
- Title
-
Altered bone growth dynamics prefigure craniosynostosis in a zebrafish model of Saethre-Chotzen syndrome
- Authors
- Teng, C.S., Ting, M.C., Farmer, D.T., Brockop, M., Maxson, R.E., Crump, J.G.
- Source
- Full text @ Elife

Coronal suture loss in tcf12; twist1b mutant zebrafish. (A) Diagrams of zebrafish, mouse, and human skulls, with neural crest contributions in turquoise and mesoderm contributions in gold. The coronal suture is at a mesoderm-mesoderm boundary in zebrafish and a neural-crest-mesoderm boundary in mouse and human. Instead of a suture, an epiphyseal bar cartilage (eb) is present at the neural-crest-mesoderm boundary in zebrafish. ms, metopic suture; ss, sagittal suture. (B) Dissected skullcaps of adult fish stained with Alizarin Red show loss of the coronal suture (asterisks) in tcf12-/-; twist1b-/- double mutants but not single mutants. Scale bar, 1 mm. (C) Micro-CT scans of adult fish heads show unilateral (left) and bilateral (right) coronal suture loss in tcf12-/-; twist1b-/- mutants. Shading indicates bone derived from neural crest (turquoise) and mesoderm (gold). Panels below are digital sections through the coronal sutures indicated by the dotted lines above. Arrowhead indicates the wild-type suture. (D) Hematoxylin and eosin-stained sections show loss of the coronal suture mesenchyme (arrowhead) in tcf12-/-; twist1b-/- mutants. Scale bar, 100 µm. PHENOTYPE:
|
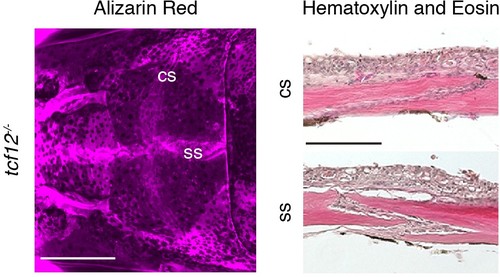
Patent sutures in tcf12 single mutants. Skull bones of an adult tcf12-/- fish were stained with Alizarin Red. Scale bar, 1 mm. Sections of the coronal suture (cs) and sagittal suture (ss) were stained with hematoxylin and eosin to show presence of suture mesenchyme. Scale bar, 100 µm. |
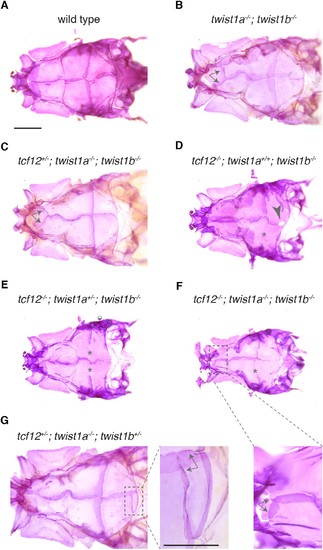
Zebrafish skull phenotypes in different mutant combinations. Dorsal views of adult zebrafish skull bones stained with Alizarin Red. We observed coronal suture loss (asterisks) in tcf12-/-; twist1b-/- mutants of any twist1a genotype (D–F). Animals lacking both Twist1 homologs occasionally develop ectopic sutures (arrows) in the anterior frontal bone region (B,C, enlarged in F). We also occasionally observed gaps (arrowhead, (D) and ectopic sutures (arrows, enlarged in G) in the posterior region of the parietal bone. Scale bars, 1 mm. |

ZFIN is incorporating published figure images and captions as part of an ongoing project. Figures from some publications have not yet been curated, or are not available for display because of copyright restrictions. EXPRESSION / LABELING:
PHENOTYPE:
|
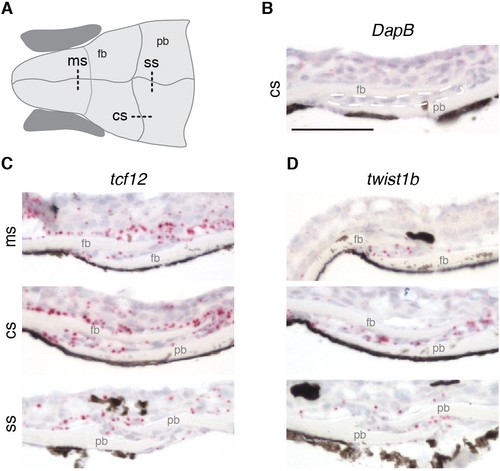
Expression of tcf12 and twist1b in multiple sutures of zebrafish. (A) Schematic of the zebrafish skull depicting positions of sections (dotted lines) used for RNAscope in situ hybridizations. cs, coronal suture; ms, metopic suture; ss, sagittal suture; fb, frontal bone; pb, parietal bone. (B–D) In situ hybridizations on sections taken from zebrafish at 14 mm standard length. Red puncta indicate positive expression. DapB (B) was included as a negative control, with suture mesenchyme outlined in a dashed white line for reference. Expression of tcf12 (C) and twist1b (D) was detected in the metopic, coronal and sagittal suture mesenchyme, with tcf12 also expressed broadly outside the sutures. n = 3 for each experiment. Scale bar, 50 µm. EXPRESSION / LABELING:
|
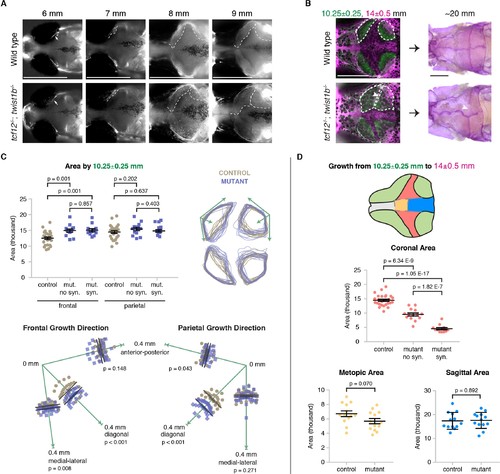
Altered bone growth dynamics precede craniosynostosis in mutant zebrafish. (A) Dorsal views of the developing skull bones in the same wild-type and mutant individuals across four developmental stages. Live fish were stained with Calcein Green at 6, 7, and 8 mm and Alizarin Red at 9 mm. For the right sides, arrows show initiation of the frontal bone at 6 mm and dashed lines show the frontal (left) and parietal (right) fronts at successive later stages. (B) Individual wild-type and tcf12; twist1b mutant fish were stained with Calcein Green at 10.25 ± 0.25 mm, recovered, and then stained again with Alizarin Red and imaged at 14 ± 0.5 mm. These same fish were then grown to 20 mm, at which stage they were fixed and stained again with Alizarin Red to assess suture patency. White dotted lines indicate bone generated by 10.25 mm. Arrowheads indicate missing coronal suture. Scale bars, 1 mm. (C) Quantification of calvarial bone growth. Bone produced by 10.25 ± 0.25 mm was calculated based on the area (µm) stained with Calcein Green (white outlines in B). At 10.25 mm, compared to control frontal bones (n = 12), tcf12; twist1b mutant frontal bones that developed synostosis later (n = 11) and those that did not (n = 11) showed similar increases in bone formation. Bone shape was assessed by overlaying tracings of posterior frontal bones and parietal bones for wild types and mutants. Specific growth directionality in the anterior-posterior, medial-lateral, and diagonal axes were measured and quantified (green arrows). (D) Bone growth from 10.25 ± 0.25 mm to 14 ± 0.5 mm was analyzed in respect to prospective suture zones. Growth in the metopic (yellow) and sagittal (blue) zones did not differ significantly in controls versus tcf12; twist1b mutants, which correlated with no defects in these sutures in mutants. In contrast, growth in the coronal zone was reduced in tcf12; twist1b mutants, with a more pronounced decrease in mutant sides that later developed synostosis. p values were determined by Student’s t-tests; error bars represent standard error of the mean. PHENOTYPE:
|
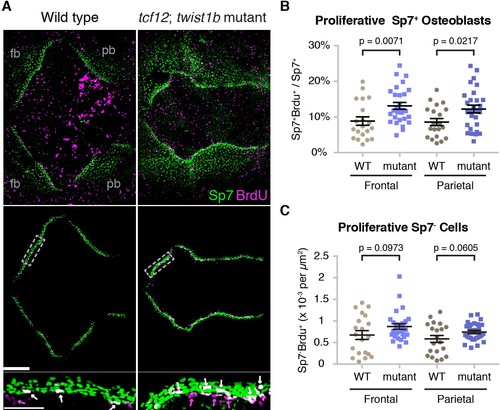
Altered proliferation and osteoblast production at mutant zebrafish bone fronts. (A) Dissected skullcaps were stained for BrdU (magenta) and Sp7 protein (green) at 9 mm. Top panels show maximum intensity projections of whole skull volumes, and middle panels are the same volumes but processed to extract the bone fronts (note that much of the BrdU staining in the center of the top images is in the skin). Bottom panels show enlarged regions of the osteogenic fronts (dotted rectangles). White arrows show proliferative osteoblasts (BrdU+/Sp7+) and magenta arrows show adjacent proliferative Sp7- cells. fb, frontal bone; pb, parietal bone. Scale bars, 300 µm for whole skull view, 100 µm for enlarged view. (B, C) Based on the extracted osteogenic fronts (middle panels in A), we quantified the percentage of Sp7+ osteoblasts that were BrdU+ (B) and the number of adjacent BrdU+/Sp7- cells per area (C). Wild-type controls, n = 20; tcf12; twist1b mutants, n = 28. p values were determined by a Student’s t-test; error bars represent standard error of the mean. EXPRESSION / LABELING:
PHENOTYPE:
|
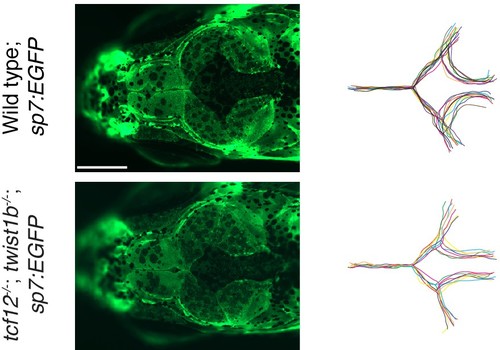
Accelerated bone fronts in tcf12; twist1b mutants transgenic for sp7:EGFP. Live imaging of sp7:EGFP was performed on wild-type sibling controls (n = 11) and tcf12; twist1b mutants (n = 7) at 10 mm standard length. Dorsal views of the skull bones showed accelerated and dysmorphic bone fronts in all mutants examined. To the right, bone fronts of individual fish were traced and overlaid according to genotype. Scale bar, 250 µm. EXPRESSION / LABELING:
PHENOTYPE:
|
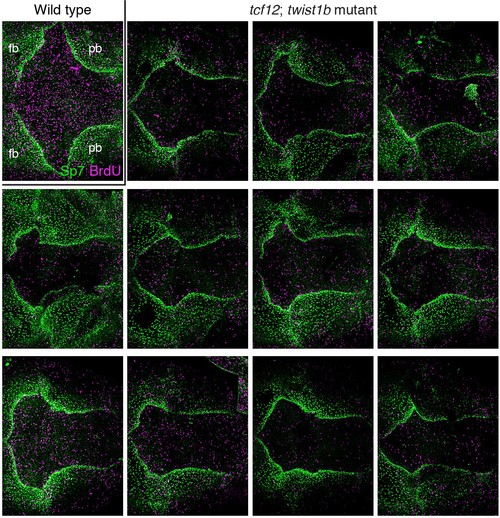
Additional examples of BrdU and Sp7 staining in tcf12; twist1b mutant zebrafish. Dorsal views of 9 mm zebrafish skullcaps stained with Sp7 antibody (green) and BrdU (magenta) show an array of altered bone shapes in mutants compared to wild type. fb, frontal bone; pb, parietal bone. EXPRESSION / LABELING:
PHENOTYPE:
|
|
ZFIN is incorporating published figure images and captions as part of an ongoing project. Figures from some publications have not yet been curated, or are not available for display because of copyright restrictions. EXPRESSION / LABELING:
PHENOTYPE:
|