
- Title
-
Cyclopropane Modification of Trehalose Dimycolate Drives Granuloma Angiogenesis and Mycobacterial Growth through Vegf Signaling
- Authors
- Walton, E.M., Cronan, M.R., Cambier, C.J., Rossi, A., Marass, M., Foglia, M.D., Brewer, W.J., Poss, K.D., Stainier, D.Y.R., Bertozzi, C.R., Tobin, D.M.
- Source
- Full text @ Cell Host Microbe

Mutations in pcaA Result in Angiogenesis-Deficient Infection Foci (A) Depiction of the M. marinum injection site within the trunk of a zebrafish larva. Bright-field and GFP channels (upper and lower panels, respectively) are shown for clarity. Dotted line indicates approximate area shown for images in (B). Scale bar, 500 μm. (B–E) Representative images of larvae at 4 days post-infection (dpi) infected with either wild-type, pcaATn28776, or complemented mutant M. marinum. Bacteria in red, vasculature in green (upper panels) or white (lower panels). Blue arrows denote infection-associated angiogenesis (B). Length of abnormal vasculature at 5 dpi for infections with pcaATn20324 (C) and 4 and 5 dpi for pcaATn28776 (D and E). Representative of more than three independent experiments for each mutant. Scale bars, 100 μm. For experiment involving pcaATn20324, ∗∗∗∗p < 0.0001; Student's t test. For all other statistics, ∗p < 0.05; ∗∗p < 0.01; ∗∗∗p < 0.001; ∗∗∗∗p < 0.0001; one-way ANOVA with Tukey's multiple comparison post-test. |

Purified TDM and Mycolic Acid Glycolipids from Wild-Type Bacteria but Not pcaA Mutants Elicit Robust Angiogenesis (A) Representative image of 2-day post-injection larvae injected dorsally with TDM. Dotted line indicates injection site and droplet coalescence. Scale bar, 500 μm. (B) Representative images of injections of either vehicle (left) or TDM (right) into Tg(kdrl:EGFP) animals. Blue arrows indicate abnormal vasculature (lower panels). Scale bars, 100 μm. (C) Quantification of abnormal vasculature induced by TDM or vehicle alone. Representative of three experiments. ∗∗p < 0.01, Student's t test. (D) Quantification of abnormal vasculature induced by MAGs isolated from wild-type or pcaA mutant M. marinum, with vehicle alone and TDM as negative and positive controls, respectively. Data from three experiments combined. ∗p < 0.05; ∗∗p < 0.01; ∗∗∗∗p < 0.0001; one-way ANOVA with Tukey's multiple comparison post-test. (E) Frequency of presence or absence of abnormal vasculature. ∗p < 0.05; ∗∗p < 0.01; ∗∗∗p < 0.001; Fisher's exact test. (F) Quantification of the length of abnormal vasculature induced by MAGs (5 mg/mL) isolated from pcaATn28776:pcaA. MAGs from wild-type and pcaATn28776 included as positive and negative controls. Data from three experiments combined. ∗p < 0.05; ∗∗∗p < 0.001; one-way ANOVA with Tukey's multiple comparison post-test. (G) Frequency of presence or absence of abnormal vasculature. ∗p < 0.05; ∗∗∗∗p < 0.0001; Fisher's exact test. (H) Representative images of larvae injected with vehicle, TDM, wild-type MAGs, MAGs isolated from pcaATn28776, and MAGs isolated from pcaATn28776:pcaA. Blue arrows indicate abnormal vasculature. Scale bars, 100 μm. PHENOTYPE:
|
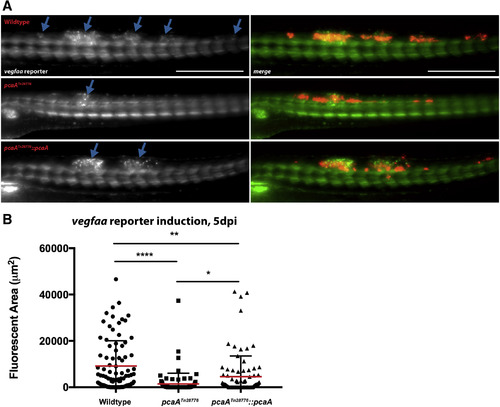
pcaA Mutants Fail to Induce Host vegfaa Reporter Expression (A and B) Representative images of TgBAC(vegfaa:EGFP) larvae 5 dpi infected with either wild-type (top), pcaA mutant (middle), or complemented pcaA mutant M. marinum (bottom). Blue arrows denote areas of GFP signal above normal developmental pattern (A). Scale bars, 500 μm. Quantification of GFP signal above baseline for wild-type, pcaA mutant, and complemented pcaA mutant larval infections. Data from three experiments combined. ∗p < 0.05; ∗∗p < 0.01; ∗∗∗∗p < 0.0001; one-way ANOVA with Tukey's multiple comparison post-test. n = 88 for wild-type infections; n = 86 for pcaA mutant; n = 86 for complemented mutant (B). |

ZFIN is incorporating published figure images and captions as part of an ongoing project. Figures from some publications have not yet been curated, or are not available for display because of copyright restrictions. PHENOTYPE:
|
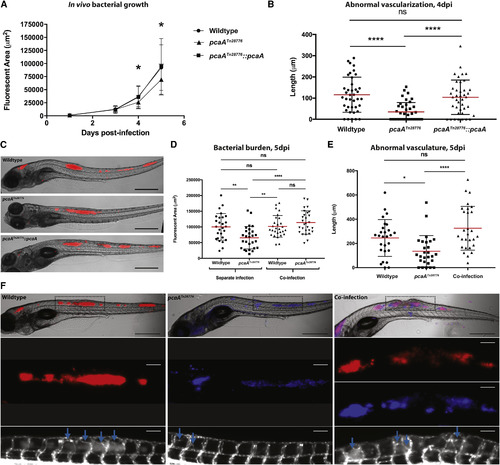
pcaA Mutant Bacteria Exhibit In vivo Growth Defects Coinciding with Onset of Granuloma Angiogenesis (A) Five-day time course of larvae infected with wild-type, pcaA mutant, or complemented mutant M. marinum strains. Bacterial burdens were measured at 1, 3, 4, and 5 dpi. At 4 dpi pcaA mutants exhibit a reduced growth rate, which persists through 5 dpi. The complemented mutant strain exhibits wild-type levels of growth throughout. Representative of three independent experiments. ∗p < 0.05; one-way ANOVA with Dunnett's multiple comparison post-test. n = 40 for each group. (B) Quantification of abnormal vascularization. The timing of the growth defect correlates with the onset of robust vascularization for wild-type and complemented strain infections but a failure to extensively vascularize infection foci for pcaA mutant strain infections. ∗∗∗∗p < 0.0001; one-way ANOVA with Tukey's multiple comparison post-test. n = 40 for each group. (C) Representative images of larvae at 5 dpi infected with each of the M. marinum strains. Wild-type, upper panel; pcaA mutant, middle; complemented mutant, lower. Scale bars, 500 μm. (D–F) Larvae possessing the Tg(kdrl:EGFP) transgene were co-infected with wild-type and PcaA mutant M. marinum. Bacterial burden (D) and length of abnormal vasculature (E) were quantified for each larva at 5 dpi. ∗p < 0.05; ∗∗p < 0.01; ∗∗∗∗p < 0.0001; one-way ANOVA with Tukey's multiple comparison post-test. Data shown represent an aggregate of two independent experiments. n = 27 for wild-type infections alone; n = 27 for pcaA mutant infections alone; n = 28 for co-infection. (F) Representative images of each infection. Upper panels: merge of bright-field and fluorescent channels. Red depicts wild-type M. marinum; blue depicts pcaA mutant M. marinum; purple depicts co-localization between the two strains. Dotted lines denote the area shown in lower panels. Scale bars, 500 μm. Middle panels: fluorescent channels alone, showing infection burden. Lower panels: vasculature. Blue arrows denote intersegmental vessel growth characteristic of granuloma angiogenesis. Scale bars, 100 μm. |
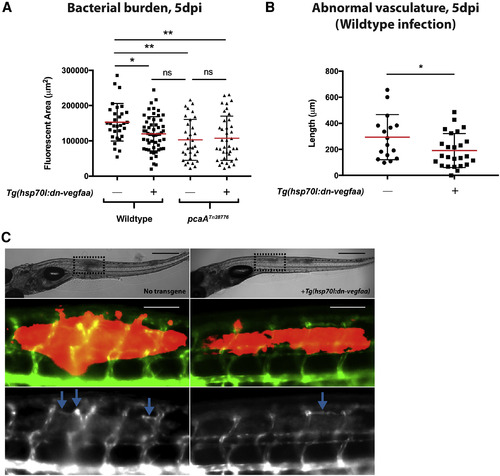
Vegf Pathway Blockade Inhibits In Vivo Growth of Wild-Type but Not pcaA Mutants (A) Bacterial burden of larvae with or without the Tg(hsp70l:dn-vegfaa) transgene at 5 dpi, infected with either wild-type or pcaA mutant M. marinum. Expression of the transgene induces a reduction in wild-type M. marinum burden compared with larvae without the transgene. Expression of the transgene had no effect on the bacterial burdens of larvae infected with the PcaA mutant strain. ∗p < 0.05; ∗∗p < 0.01; one-way ANOVA with Tukey's multiple comparison post-test. n = 31 and n = 55 for wild-type infections in larvae without or with the Tg(hsp70l:dn-vegfaa) transgene, respectively; n = 33 and n = 39 for pcaA mutant infections in larvae without or with the Tg(hsp70l:dn-vegfaa) transgene, respectively. (B) Quantification of abnormal vasculature during wild-type infections for Tg(kdrl:EGFP)+ larvae with or without the Tg(hsp70l:dn-vegfaa) transgene. The double transgenic larvae were present as a subset of the cross between the Tg(kdrl:EGFP) and Tg(hsp70l:dn-vegfaa) transgenic lines. Induction of the Tg(hsp70l:dn-vegfaa) transgene results in a reduction in infection-induced angiogenesis. ∗p < 0.05, Student's t test. n = 16 and n = 25 for larvae without or with the Tg(hsp70l:dn-vegfaa) transgene, respectively. (C) Representative images of vascularization in larvae with the Tg(hsp70l:dn-vegfaa) transgene (right panels) and without (left panels). Upper panels: bright field, with the dotted line depicting regions shown in the lower panels. Scale bars, 500 μm. Middle panels: merge of vasculature and infection. Lower panels: vasculature alone. Scale bars, 100 μm. All quantitation performed blind to genotype. PHENOTYPE:
|
|
ZFIN is incorporating published figure images and captions as part of an ongoing project. Figures from some publications have not yet been curated, or are not available for display because of copyright restrictions. PHENOTYPE:
|
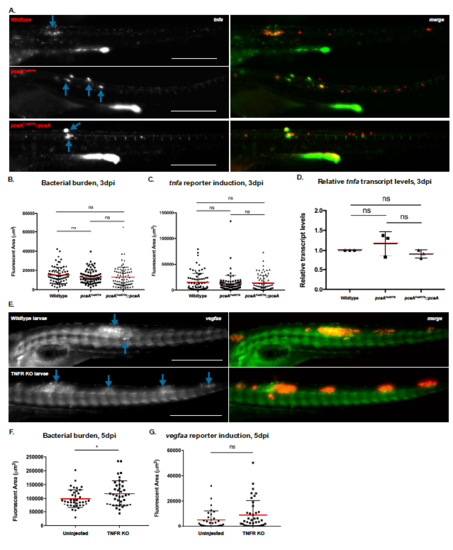
Vegf Pathway Activation during M. marinum Infection does not Require TNF Signaling. A. Representative images of TgBAC(tnf:GFP) larvae at 3 dpi infected with either wildtype (top), pcaA mutant (middle), or complemented mutant M. marinum (bottom). Blue arrows denote robust GFP expression in nascent granulomas indicative of tnfa transcriptional activation. Scale bars = 500m. B. Quantification of average bacterial burden for each infection group. C. Quantification of GFP signal. There were no significant differences on average among the groups, indicating similar levels of tnfa transcription at this timepoint; One-way ANOVA with Tukey’s multiple comparison posttest. N=78 for wildtype infections; N=79 for pcaA mutant infections; N=78 for complemented mutant infections. D. RT-qPCR assessment of relative tnfa transcript levels, normalized to wildtype levels. As with the TNF reporter data, no differences were observed between the infection groups. Data from 3 experiments combined. E. Representative images of wildtype (top) and mosaic CRISPR/Cas9-mediated TNFR knockout larvae (bottom), transgenic for TgBAC(vegfaa:EGFP) and infected with wildtype M. marinum, 5dpi. Blue arrows denote regions of robust GFP signal above background, indicating vegfaa transcriptional activation. Scale bars = 500m. F. Quantification of bacterial burden. The mosaic TNFR knockout group exhibited an increase in average bacterial burden at 5dpi, as has been previously observed for M. marinum infections of TNFR-deficient larvae. G. Quantification of GFP signal above background at 5dpi. GFP signal was not significantly different between either group, and in fact a trend of increasing signal in the mosaic knockout group was observed. *p<0.05; Student’s t-test. N=39 control larvae; N=40 TNFR KO larvae. |