
- Title
-
A systems biology approach uncovers the core gene regulatory network governing iridophore fate choice from the neural crest
- Authors
- Petratou, K., Subkhankulova, T., Lister, J.A., Rocco, A., Schwetlick, H., Kelsh, R.N.
- Source
- Full text @ PLoS Genet.

Detection of developing iridophores using expression of tfec. (A) Chromogenic WISH identifies tfec transcription in positions matching iridophore (iph) positions at 72 hpf. Images show the posterior trunk of the same individual, live and post-WISH processing. (B) tfec is expressed in sox10-positive NCCs (region in brackets) at 18 hpf, which have downregulated foxd3 but have not yet detectably activated early pigment lineage markers such as ltk, mitfa and pnp4a. (C) RNAscope reveals co-expression of tfec and ltk (arrows) in the anterior region of the posterior trunk (ARPT) during the timecourse of iridoblast specification, both in medially migrating cells at 24 hpf, and in dorsally located specified iridoblasts (ib(sp)) and iph at 30 hpf and 48 hpf, respectively. (C’) Nearly 100% of tfec+ cells co-express ltk during iridophore development (see S3 Table). Error bars indicate standard deviation between embryos. p-values were derived using a two-tailed, unpaired t-test. Using WISH at 24 hpf (D,E) tfec transcription is detectable in most or all cells of the multipotent premigratory NC domain (D, red line) and in a subset of cells of the posterior trunk located dorso-laterally to the spinal cord (D, vertical arrow) and in the medial pathway, between the somites and the notochord (D, horizontal arrow; Ei, arrows). Expression is only more weakly detectable in cells on the lateral pathway along the ARPT, between epidermal keratinocytes and somites (Eii, arrow). At 30 hpf (F,G) tfec is expressed in premigratory NCCs of the tail (red line) and in expected iridoblast positions, specifically dorsally located and medially migrating cells of the posterior trunk, the developing lateral patches and the eye (arrows). At 48 hpf (H) tfec is expressed along the dorsal, ventral and yolk sac stripes (vertical arrows), as well as in the lateral patches (arrowhead) and overlying the eye (horizontal arrow), in a pattern distinctive of differentiated iridophores. (I) RNAscope indicates presence of mitfa transcript in tfec-positive cells (arrows) migrating along the medial pathway in the ARPT at 24 hpf, but not in those located dorsally at 30 hpf, or at 48 hpf. In all three stages, mitfa+;tfec- cells are detectable (asterisks). (I’) Mean percentages of tfec+ cells co-expressing mitfa at each stage of development (refer to S3 Table). Error bars indicate the standard deviation between embryos. A two-tailed, unpaired t-test was used to derive indicated p-values. All panels show lateral views, except dorsal views in (A; D,F insets). Head towards the left. RNAscope panels: single focal planes shown. e, epidermis; ICM, intermediate cell mass; LPs, lateral patches; no, notochord; RL, reflected light. Scale bars: (A,B,D,E,F,G,H) 50 μm; (C,I) 20 μm. EXPRESSION / LABELING:
|
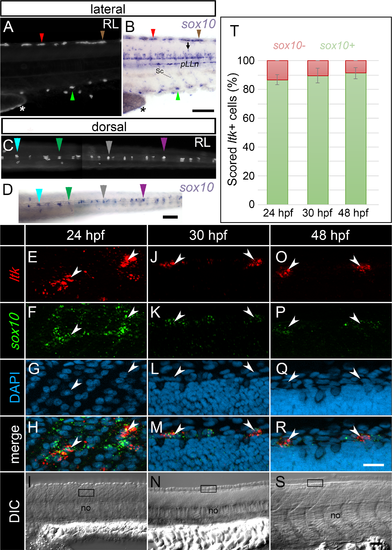
sox10 expression is maintained throughout iridophore development. (A, B) lateral views of the anterior tail of a single embryo at 72 hpf, imaged live under reflected light (RL) (A) and then post-WISH to detect sox10 transcript (B). (C, D) dorsal views of the trunk and anterior tail of a second individual pre- (C) and post- (D) WISH processing for sox10 expression at 72 hpf. Differently coloured arrowheads point to individual iridophores expressing sox10. sox10 is also detected in developing oligodendrocytes (B, arrow), Schwann cells (B) and in iridophores along the yolk sac stripe (A, B asterisk). ltk-positive cells detected via RNAscope (E, J, O arrowheads) all show sox10 transcript (F, K, P; H, M, R arrowheads), at each of 24 (E-I), 30 (J-N) and 48 hpf (O-S). At 24 hpf, cells on the medial migration pathway are shown (I, boxed region). At 30 hpf and at 48 hpf, cells along the developing dorsal stripe are presented (N, S, boxed regions). (T) Quantification of the proportion of ltk+ cells co-expressing (green), or not co-expressing (red) sox10 by RNAscope, at 24, 30 and 48 hpf. Error bars indicate the corresponding standard deviations. (E-S): lateral views of single focal planes. (A-S): heads positioned towards the left. Sc, Schwann cells; pLLn, posterior lateral line nerve; no, notochord; RL, reflected light. Scale bars: (A-D) 100 μm; (E-H, J-M, O-R) 20 μm; (I, N, S) 50 μm. EXPRESSION / LABELING:
|

A sox10-dependent tfec/ltk positive feedback loop is required for iridophore specification. WISH to detect tfec (A-H) and ltk (I-L) expression at 30 hpf (A-D, I, J) and 48 hpf (E-H, K, L) in WT and mutant embryos, with quantitation (M,N). At 30 hpf, sox10 mutants (B) lack tfec expression in medially migrating iridoblasts (A, arrows) and instead show a striking anteriorly expanded multipotent progenitor domain (B, arrowheads). Both ltk (C) and tfec mutants (D) display a reduced number of medially migrating ib(sp) (horizontal arrows) at 30 hpf, while dorsally located ib(sp) of the posterior trunk and tail (vertical arrows) are only significantly reduced in ltk mutants. At 48 hpf, sox10 (F) and ltk (G) mutants lack tfec-labelling in the position of WT iph (E, asterisks), while tfec mutants (H) display a reduced number of cells in these positions expressing tfec (H, asterisks; N). At both 30 hpf (I, J) and 48 hpf (K, L), tfec mutants lack ltk expression in ib(df) (I, J, arrows) and in iph (K, L, asterisks) locations, with the exception of rare escaper cells. (M) Quantitation of tfec-expressing iridophore lineage cells at 30 hpf. Counts for tfec-positive ib(df) along the dorsal posterior trunk, the migration pathways, and the lateral patches are shown from left to right. (N) Quantitation of tfec-expressing cells along the posterior trunk and tail at 48 hpf. At this stage, scored cells are in iph positions. tfec mutants display almost complete lack of ltk-positive cells both along the dorsal and the ventral stripes compared to their siblings, while tfec positive cells in both regions are partially reduced. p-values given in (M,N) were produced using a two-tailed unpaired t-test to determine the statistical significance of differences between means. ns: p > 0.05. Box-and-whisker plots in M and N show mean, 1st and 3rd quartiles and range excluding outliers, which are indicated by dots. (O) Overexpression of WT sox10 mRNA results in an increased number of tfec transcripts, compared to overexpression of null sox10 mRNA. Graph represents 2 biological replicates, each with 3 technical replicates. Error bars indicate respective standard deviations. A-L) Lateral views, head positioned towards the left. Scale bars: 100 μm. |
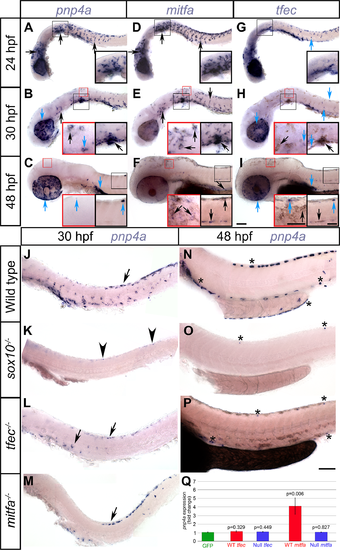
pnp4a is activated by mitfa in premigratory and migrating NC, and by cooperative action of sox10 and tfec in iridoblasts. At 24 hpf and at 30 hpf, chromogenic WISH reveals strong similarities between the pattern of pnp4a and mitfa in migrating NC in the trunk and in cells posterior to the otic vesicle (A, B, D, E, black arrows), but which is distinct from tfec, which is present in more restricted groups of cells (G, H, blue arrows). At this stage, melanising cells in the head and anterior trunk show distinct expression of both mitfa and pnp4a (B,E, insets, black arrows). At 48 hpf, mitfa is expressed in melanised cells (F, black arrows), but pnp4a is not detectable in these melanocytes (C). From 30 hpf, some aspects of pnp4a expression are similar to those of tfec (B, H, blue arrows) and at 48 hpf both genes are expressed in ib(df) locations (C, I, blue arrows). (J-Q) Mutant analysis. At 30 hpf, mitfa (M) and tfec (L) mutants retain only a subset of the WT pnp4a expression; remaining cells in the former display a ib(df) pattern and in the latter a melanoblast pattern (M, L, arrows). tfec mutants lack pnp4a expression at 48 hpf, with the exception of rare escaper cells in iridophore positions (P, asterisks). Note that embryo in N, but not in O or P, was treated with PTU to inhibit melanisation; dark pigment in P is melanin. In sox10 mutants, pnp4a is largely absent, although weak expression persists in a few premigratory NCCs (K, arrowheads) at 30 hpf, and in rare escaper cells in iridophore positions at 48 hpf (O, asterisks). (Q) qRT-PCR measurement of pnp4a expression after expression of Mitfa or Tfec in early zebrafish embryos. Overexpression of WT Mitfa results in ectopic activation of pnp4a in injected embryos at 6 hours post-injection, whereas mutant Mitfa (null) does not. Interestingly, neither WT nor mutant Tfec is sufficient to drive pnp4a expression at this stage. Fold activation is calculated following normalisation to pnp4a levels upon overexpression of GFP. Graph is representative of 2 biological replicates, each with 3 technical replicates. Error bars indicate respective standard error of the mean. p-values indicate the significance of mean fold change for each sample when compared to the mean of GFP, using a two-tailed, unpaired t-test. Lateral views, head towards the left. Scale bars: 100 μm. Inset scale bars: 50 μm. |

pnp4a expression is affected in early melanoblasts in mitfa mutants, and in presumptive iridoblasts, but not melanoblasts, in ltk mutants. Chromogenic WISH at 24 hpf shows almost complete elimination of pnp4a expression from the NC derivatives of the dorsal trunk (vertical arrowheads) and the migratory pathways (arrows) of mitfa mutants (B, B’), compared to WT siblings (A, A’). Expression in the RPE domain is reduced (horizontal arrowheads). WISH at 30 hpf (C-D’) reveals persistence of pnp4a expression in migrating cells which we interpret as melanoblasts, in ltk mutants (asterisks), as well as in the multipotent progenitor domain of the posterior tail (vertical arrowheads). We also observe a reduced number of cells in iridoblast locations: overlying the RPE (horizontal arrowheads), in the developing lateral patches and along the dorsal posterior trunk (arrows, enlarged in C’,D’). At 48 hpf (E,F), the majority of pnp4a-positive cells in iridophore locations are absent in ltk mutants. Specifically, cells overlying the RPE (horizontal arrowheads), on the lateral patches and along the dorsal and ventral posterior trunk and tail (arrows) are dramatically reduced. Very few escaper iridophores (F, arrows) maintain strong pnp4a expression upon loss of ltk function. LP, lateral patches. Lateral views, heads positioned towards the left. Scale bar corresponds to 100 μm in A,B,C,D,E,F and to 50 μm in A’,B’,C’,D’. |
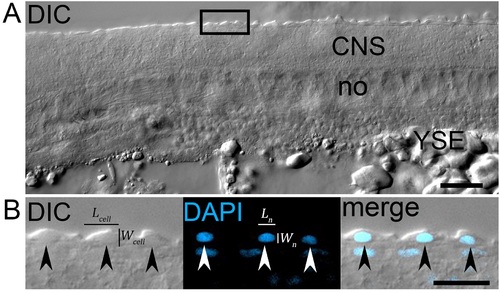
The mean cytoplasmic volume of cells in the dorsal ARPT can be calculated using high resolution DIC images combined with DAPI staining. (A) DIC image of a single focal plane from a Z-stack, showing the ARPT of a 24 hpf WT embryo. (B) Magnified view of the boxed region in (A). DIC allows for identification of the boundaries of the cells directly dorsal to the CNS (likely epidermal), while DAPI stain renders the nuclei visible. It is thus possible to measure the length (L) and width (W) of whole cells (arrowheads), as well as of their respective nuclei. CNS, central nervous system; no, notochord; YSE, yolk sac extension. Lateral view, head positioned towards the left. Scale bar: A: 50 μm; B: 20 μm. |
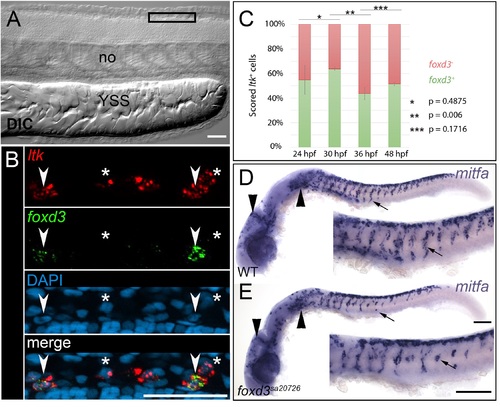
foxd3 is not a good candidate for the role of factor R in the iridophore lineage. (A, B) RNAscope experiments at 36 hpf reveal that foxd3 does not fulfil the criteria established using our models for factor R, as it is only expressed in a subset of ltk+ ib(df) of the posterior dorsal trunk. In (B) arrowheads point at ltk+ cells that co-express foxd3, while asterisks indicate cells that are only positive for ltk. (C) RNAscope experiments at 24 hpf, 30 hpf, 36 hpf and 48 hpf indicate that 55%, 64%, 44% and 52%, respectively, of ltk+ cells co-express foxd3. t-tests suggest that the proportion of cells co-expressing the two genes only significantly changed between 30 hpf and 36 hpf. (D,E) foxd3 mutants subjected to WISH at 24 hpf present with a reduction of mitfa+ cells along the migratory pathways of the posterior trunk. WT and mutant embryos show no difference in cranial NC derived mitfa+ populations (arrowheads), but noticeable and consistent decrease of migrating trunk NC derivatives (*arrows). no, notochord; YSS, yolk sac stripe. Lateral views, head towards the left. Scale bars: (A,B) 50 μm, (D,E) 100 μm. |