- Title
-
Damage-induced reactive oxygen species enable zebrafish tail regeneration by repositioning of Hedgehog expressing cells
- Authors
- Romero, M.M.G., McCathie, G., Jankun, P., Roehl, H.H.
- Source
- Full text @ Nat. Commun.
|
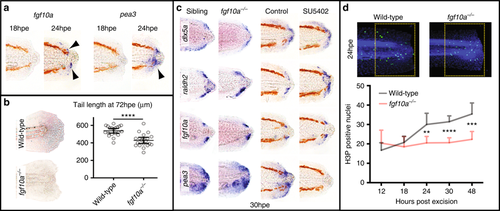
FGF signalling is required for cell proliferation during larval tail regeneration. a Arrowheads point to expression of the FGF ligand, fgf10a, and the downstream target, pea3, become evident by 24 hpe (10/10 for both, number of experiments = 3). b fgf10a−/− fish have reduced tail regrowth compared to wild-type fish. Larvae were imaged at 72 hpe. Tail length was determined using the Measure macro in ImageJ software by placing a rectangle parallel to the body that started at the anus and finished at the caudal end of the fin fold. Unpaired t test two-tailed results in P < 0.0001 indicated as **** (sibling n = 20, fgf10a−/− n = 20, number of experiments = 3). c Expression of dlx5a and raldh2 are not strongly affected when FGF signalling is reduced. SU5402 treatment was done from 26 to 30 hpe at 10 μM concentration. This treatment is sufficient to abolish detection of the FGF downstream target pea3 (10/10 for each panel, number of experiments = 2). d Whereas in wild-type fish DNA mitosis increases after tail excision, in fgf10a−/− fish mitosis remains constant (wild type/12 hpe n = 8, wild type/18 hpe n = 8, wild type/24 hpe n = 19, wild type/30 hpe n = 21, wild type/48 hpe n = 14, fgf10a−/−/12 hpe n = 8, fgf10a−/−/18 hpe n = 8, fgf10a−/−/24 hpe n = 12, fgf10a−/−/30 hpe n = 20, fgf10a−/−/48 hpe n = 12, number of experiments = 2). Statistics performed with ordinary one-way ANOVA (nonparametric) with multiple comparisons and Sidak hypothesis testing. ****P < 0.0001, ***P = 0.0001 and **P = 0.005 |
|
Wnt/β-Catenin signalling is required for patterning during larval regeneration. a Expression of the Wnt ligand, wnt10a, and the downstream target, tcf7, become evident by 18 hpe (arrowheads) (wnt10a/18 hpe 7/8, wnt10a/24 hpe 10/10, tcf7/18 hpe 9/10, tcf7/24 hpe 10/10, number of experiments = 2). b Larvae treated with 10 μM IWR-1 continuously after excision show no signs of regeneration at 96 hpe (10/10 number of experiments = 2). c Heterozygous hs:dkk1 fish and their siblings were heatshocked by placing in an incubator at 39 °C and sorted based by fluorescence present in the transgenic line. Nonfluorescent fish served as control fish. The GskXV treatments were done at 10 μM (hs:dkk1/dlx5a 10/10, hs:dkk1/raldh2 10/10, number of experiments = 2) (GskXV/dlx5a 10/10, GskXV/raldh2 10/10, number of experiments = 4). d Expression of fgf10a and pea3 are downregulated in hs:dkk1 larvae (treatment as in panel c) and upregulated in fish treated with 12.5 μM GskXV (hs:dkk110/12 control, 28/30 transgenic, number of experiments = 2) (GskXV control 12/12, treated 11/12 number of experiments = 2). e Expression of the Wnt/β-Catenin target gene axin2 is reduced in fish treated with 10 μM SU5402 (12/12, number of experiments = 3) |
|
Hedgehog signalling plays a central role during larval tail regeneration. a Continuous treatment with the Hedgehog pathway inhibitors cyclopamine (20 μM) and LDE225(20 μM) blocks regeneration (Cyclopamine 10/10, LDE 10/10, number of experiments = 2) (Control 20/20, number of experiments = 4). Cyclopamine pulse treatment blocks regeneration (8/10, number of experiments = 2). b Larvae treated with cyclopamine (20 μM) and LDE225 (20 μM) from 0 to 48 hpe have reduced expression of dlx5a and msxc (for all panels results are 10/10, number of experiments = 2). c Wound-induced expression of markers for the Wnt/β-Catenin, FGF and RA pathways is lost after treatment with cyclopamine. Larvae in the wnt10a and pea3 panels were treated with 50 μM cyclopamine from 0 to 30 hpe. tcf7, fgf10a and raldh2 panels were treated with 20 μM cyclopamine from 0 to 48 hpe (for all panels results are 10/10, number of experiments = 2). d Cell proliferation is inhibited by treatment with cyclopamine (control n = 10, cyclopamine n = 8, number of experiments = 2). This analysis was done as in Fig. 1d. Unpaired t test two-tailed results in P < 0.0001 indicated as ****. e Upregulation of Wnt/β-Catenin signalling after cyclopamine treatment restores expression of dlx5a, msxc and raldh2 (for all panels results are 10/10, number of experiments = 3). Arrowheads indicate partial rescue of marker expression. Larvae were treated from 0 to 40 hpe with 50 μM cyclopamine and then incubated in 10 μM GskXV until fixation |
|
The Hedgehog pathway is activated immediately after tail excision. a ihhb expression is detected within the notochord bead and continues until 30 hpe (0 hpe 2/10, more than 8/10 for the other time points, number of experiments = 3). Expression of ptch1 is upregulated by 18 hpe and continues after 30 hpe (10/10 for both time points, n = 2). Arrowheads point to expression domains. b Oblique and coronal sections reveal that ihhb is expressed in the notochord before (12/14, number of experiments = 2). c ihhb is expressed in the notochord after tail excision (7/7, number of experiments = 2) |
|
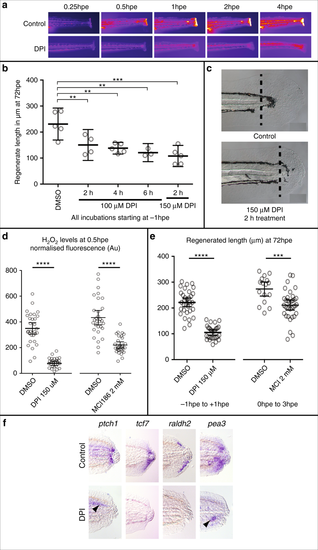
ROS activity immediately after tail excision. a Time course showing production of ROS after tail excision is reduced in larvae treated with 150 μM DPI from 1 h prior to excision. Larvae were bathed in 10 μM PFBS-F (205429, Santa Cruz) to detect ROS. b Optimisation to show that treatment for as little as 2 h (1 h pretreatment and 1 h post-treatment) is sufficient to reduce tail regrowth by >50%. Regrowth was quantified from images using the Measure macro in ImageJ by placing a rectangle parallel to the body that started at the end of the notochord and finished at the caudal end of the fin fold. Significance was calculated using one-way ANOVA with Dunnett’s multiple comparisons test and each sample compared to the DMSO control (DMSO n = 5; 100 μM DPI/2 h n = 4 and P = 0.0096; 100 μM DPI/4 h n = 5 and P = 0.0018; 100 μM DPI/6 h n = 3, P = 0.0015; 150 μM DPI/2 h n = 5, P = 0.0001; number of experiments = 1). c Representative larval tails showing the extent of tail regrowth after DPI treatment. d Quantification of PFBS-F fluorescence shows that DPI treatment has a stronger effect on ROS levels than MCI186. Thirty larvae were analysed for each sample except for DPI which had only 29 (number of experiments = 2). **** indicates P < 0.0001. e Comparison of the efficacy of DPI to MCI186 in regards to regenerated tail length. Measurements were made as in panel a (DMSO n = 33, DPI n = 29, number of experiments = 3) (DMSO n = 16, MCI186 n = 33; number of experiments = 3). **** indicates P < 0.0001, *** indicates P = 0.005. f DPI treatment inhibits wound-induced activation of the Hedgehog, Wntβ-Catenin, RA and FGF pathways. Larvae were pretreated with 150 μM DPI for 1 h and for 6 hpa in 100 μM DPI. Larvae were then washed in E3 buffer and incubated until 24 hpa or 48 hpf in the case of tcf7 (ptch1 19/19, tcf7 7/9, raldh2 13/19, pea3 9/9). Arrowheads point to expression of pea3 and ptch1 that is found in unoperated animals (see also Supplementary Figure 2) |
|
ROS and Hedgehog signalling do not have similar roles during tail development. a DPI treatment at 100 μM from 14 to 24 hpf does not affect larval tail morphology (10/10, number of experiments = 3). Scale bar is 200 μm. b shha and ihhb expression in the tail is not affected by DPI treatment at 100 μM from 14 to 18 hpf (20/20 for all panels, number of experiments = 2). c tcf7 and raldh2 expression in the tail bud is not affected by treatment with 20 μM cyclopamine from 8 to 16 hpf (20/20 for all panels, number of experiments = 2). d Loss of Hedgehog signalling does not affect tail formation. Larvae were treated with 20 μM cyclopamine from 8 to 10hpf (10/10, number of experiments = 2). Homozygous smob577 mutants (7/7, number of experiments = 2) lack zygotic Hedgehog signalling activity. Embryos were manually dechorionated prior to chemical treatment |
|
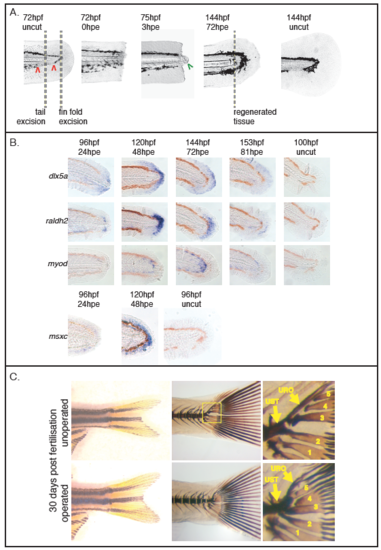
Larval tail regeneration. (A) When cut in the pigment gap (zone between the two red arrows), the notochord bead (the green arrow) is extruded within 3hpe and the tail regenerates within 4-5 days. The position of fin fold excision is shown for comparison. (B) Different stages of regeneration are marked by the expression of dlx5a, raldh2, myod and msxc (all panels 10/10 except dlx5a/24hpe 8/10, raldh2/24hpe 8/10, myod/48hpe 8/10, number of experiments = 3). Uncut fish are shown to the right for comparison. (C) Live images of the tail after metamorphosis is complete (left panels) and Von Kossa stain showing the failure of the notochord to extend dorsally (right panels). In unoperated fish the uroneural and hypurals 3-5 form around and are attached to the notochord which grows dorsally as the adult tail forms. After excision these bones all form on the urostyle suggesting that the dorsal flexure of the notochord has not occurred (both operated and unoperated are 5/5, number of experiments = 2). Abbreviations: urostyle (ust), uroneural (uro) and hypural 1-5 (1-5). |
|
There appears to be a change in pressure within the notochord at the start of extrusion. Close-up of notochord after tail excision to show cell membranes are bowed towards anterior at the start and then become bowed towards the posterior. The yellow arrowhead tracks one membrane. Not all fish show bowing to the anterior, the prevalence of this phenotype varies by age, position on the anterior/posterior axis and strain used. We have found the AB wildtype strain at 72hpf is most reliable. Images captured every 30 seconds as in Supplementary Movie 1. Numbers indicate time in minutes. Scale bar = 100μm. |
|
Expression of signalling genes in the larval tail. (A) fgf10a is expressed weakly in neuromasts (arrowheads). (B) pea3 is expressed in neuromasts (arrowheads) and has weak expression in the fin fold. (C) wnt10a has weak expression in the ventral fin fold (arrowhead). (D) tcf7 has no detectable expression. (E) ihhb has no detectable expression. (F) ptch1 has weak expression in tissue neighbouring the notochord (arrowhead) (10/10 for all panels, number of experiments = 3). |
|
fgf10a does not act during tail development. (A) Arrowhead indicates fgf10a expression in the tail. (B) Development of the fgf10a-/- larval tail is indistinguishable from wild-type. (C) Measurement of tail growth does not show a significant difference between fgf10a-/- and wild-type fish. Tails were measured as in Figure 1 (n = 20 for both, number of experiments = 2). |
|
shha is expressed in the notochord bead and Hedgehog signalling is unaffected by manipulation of other developmental pathways. (A) shha is expressed in the notochord bead (arrowheads) (n = 3/7 for 0hpe and 11/12 for 3hpe, number of experiments = 2). (B) The activity of the Hedgehog pathway was monitored by in situ hybridisation for ptch1. Larvae were treated with GskXV at 12.5μM from 40-48hpa to activate the WNT/β-Catenin pathway. hs:dkk1b-GFP fish were heatshocked for three hours at 39°C at 28hpa and allowed to recover for 17 hours at 28.5°C to inhibit the Wnt/β-Catenin pathway. Larvae were treated with SU5402 at 15μM from 44-48hpf to inhibit the FGF pathway. Larvae were treated with 100 μM DEAB from 1-48hpa to block the RA pathway. Larvae were treated with RA at 2.5μM from 43.5-48hpf to activate the RA pathway (10/10 for all panels, number of experiments = 2). |
|
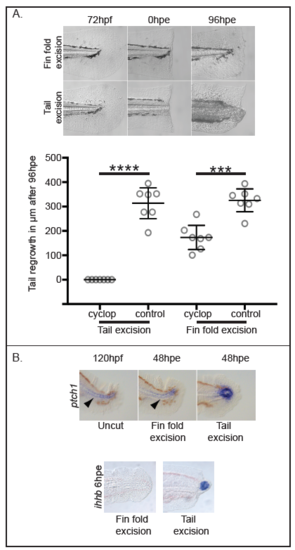
Hedgehog signalling does not play a crucial role in fin fold regeneration. (A) Treatment with 20μM cyclopamine is sufficient to block regeneration and has a milder affect on fin fold excision. Regrowth was measured from images in Fiji/ImageJ software by placing a rectangle parallel to the body that started at the end of the notochord and finished at the caudal end of the fin fold (n = 7 for each sample, number of experiments = 2). (B) Neither ptch1 nor ihhb are noticeably upregulated following fin fold excision. Arrowheads indicate low levels of ptch1 expression in unoperated and fin fold excision larvae (10/10 for each sample except for ihhb/tail excision 9/10, number of experiments = 2). |
|
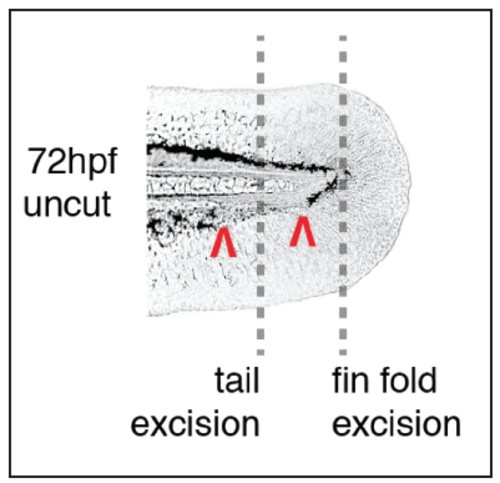
Methods image to illustrate the position of tail excision. The picture shows the position for tail excision compared to fin excision (grey dotted lines). The pigment gap marked by red arrowheads. |
|
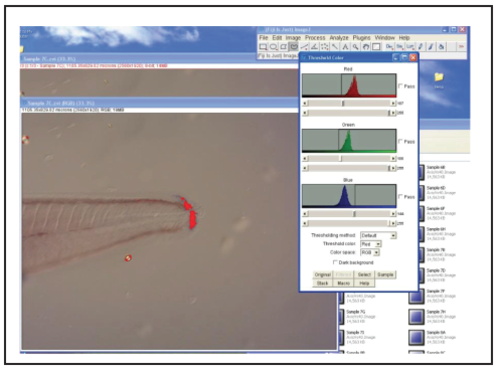
Methods image to illustrate RGB-based quantification. The picture shows a screenshot of ImageJ/Fiji to illustrate how RGB threshold limits are set. |
|
Methods image to illustrate fluorescence quantification. The picture shows a screenshot of ImageJ/Fiji Wound-induced HO quantification macro to illustrate how regions for quantification are set. The fish, wound area and trunk regions outlined in white, yellow and red, respectively. Scale bar is 200μm. |
|
Methods image to illustrate Menger curvature measurement. The picture shows screenshots of ImageJ to show how curvature is measured. The example shown was measured as having a curvature of 0.0292μm-1. |
|
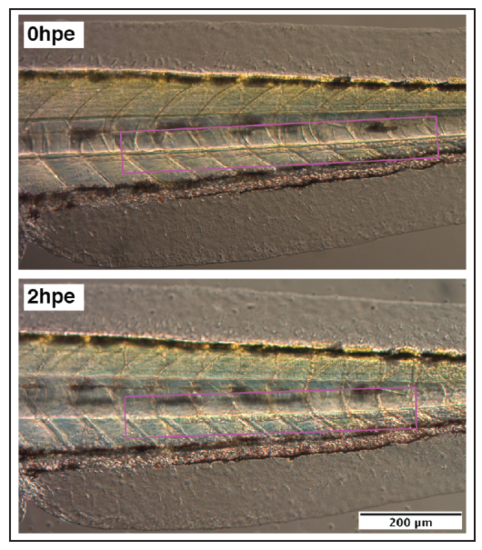
Methods image to illustrate measurement of trunk contraction. The picture shows screenshots of ImageJ to show how trunk contraction is measured. The rectangle drawing tool is shown in magenta. This example was measured as 630μm before excision and 580μm after excision, giving a contraction of 8%. |

