
- Title
-
A transgenic zebrafish model for in vivo long-term imaging of retinotectal synaptogenesis
- Authors
- Du, X.F., Xu, B., Zhang, Y., Chen, M.J., Du, J.L.
- Source
- Full text @ Sci. Rep.
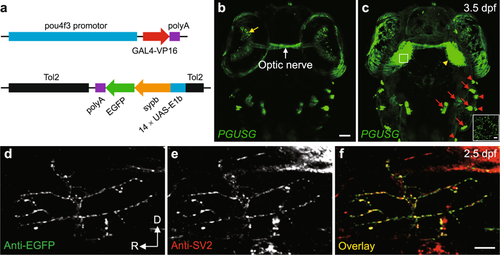
Visualization of RGC pre-synaptic terminals in double transgenic zebrafish PGUSG. (a) Schematic of the DNA constructs used for generating the GAL4 line Tg(pou4f3:GAL4-VP16) (PG) and the UAS line Tg(14 × UAS-E1b:sypb-EGFP) (USG). (b,c) Dorsal views of a PGUSG double transgenic larva at 3.5 dpf showing EGFP expression in RGCs (soma in the retina, yellow arrow; axonal arbors in the tectal neuropil, yellow arrow head) and mechanosensory hair cells of the inner ear (red arrow) and lateral line (red arrow head). Images in (b) and (c) are the maximum-intensity-projection view of more ventral z-stack and the whole z-stack, respectively. Inset in (c), zoom-in view of a single optical section of the boxed area in left tectal neuropil showing the punctate signal of Sypb-EGFP on RGC axonal arbor. The optic nerve (white arrow) is visible. The nasal is upwards. Scale bar, 50 μm for each panel; 5 μm for inset. (d–f) Confocal images of single spinal motor neuron in EGUSG (see Methods) double immuno-labelled with EGFP (d) and SV2 (e) antibodies at 2.5 dpf. Colocalization of Sypb-EGFP with pre-synaptic SV2 is demonstrated by the overlap (f, yellow) of anti-EGFP and anti-SV2 puncta. D, dorsal; R, rostral. Scale bar, 10 μm. |
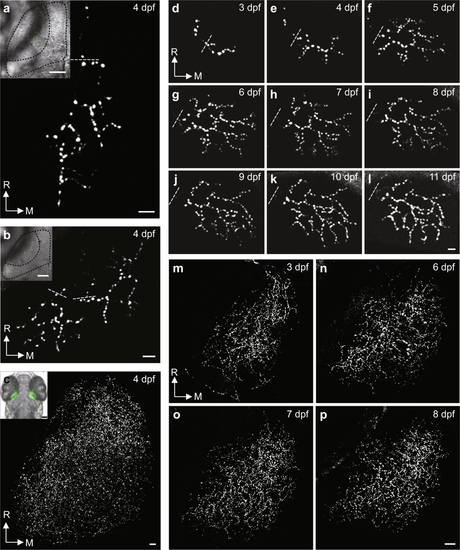
Long-term stable in vivo imaging of retinotectal pre-synaptic terminals in PGUSG larvae with single or multiple RGCs labelled. (a–c) Examples of single (a), two (b) and multiple (c) Sypb-EGFP labelled RGC axonal arbors within one tectal hemisphere from different PGUSG fish at 4 dpf. Insets, topographic position of RGC axonal arbors in the tectal neuropil. In each inset, an optical section of bright-field image and a stack of green fluorescent images are superimposed. Dashed black curve, the profiles of half tectum and half neuropil. (d–p) Time series showing maximum-intensity-projection view of the same single (d–l) and multiple (m–p) Sypb-EGFP labelled RGC axonal arbors at 3–11 dpf and at 3, 6, 7 and 8 dpf, respectively. Autofluorescence of the skin is visible in the right upper corner in panel (j), (k) and (l). Dashed white line, position above the first branch point of each axonal arbor. R, rostral; M, medial. Scale bar: 5 μm in each panel; 50 μm in panel inset. |
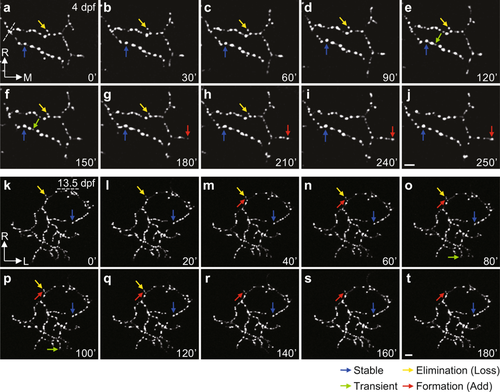
Remodelling of Sypb-EGFP puncta on the axonal arbor of individual RGCs. (a–t) Time-lapse two-photon images of individual RGC axonal arbor expressing Sypb-EGFP showing synaptic remodelling at both early (4 dpf, a–j) and late (13.5 dpf, k–t) larval stages, respectively. At 13.5 dpf, we used pigment mutants of PGUSG (PGUSG; casper). Arbors were imaged at 10 min intervals for at least 3 h. Time in minutes is indicated in the bottom right corner of each panel. The coloured arrows indicate examples of puncta with different behaviours: stable (blue), existing through the entire imaging time period; elimination (yellow), existing at the beginning but lost during imaging; transient (green), newly added during imaging but lost before the end of imaging; formation (red), newly added during imaging and maintained till the end of imaging. L, lateral; M, medial; R, rostral. Scale bar, 5 μm. |
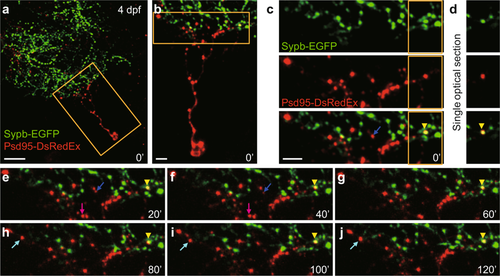
Simultaneous imaging of pre- and post-synaptic compartments of retinotectal synapses. (a) First image of a time-lapse series showing the Psd95-DsRedEx labelled post-synaptic sites on the dendritic arbor of a tectal neuron (red) and the Sypb-EGFP labelled pre-synaptic terminals on the axonal arbor of multiple RGCs (green) in a 4-dpf PGUSG larva with transient expression of elavl3:psd95-DsRedEx. The nasal is upwards. Scale bar, 20 μm. (b) Enlarged view of the boxed region in. (a) Scale bar, 5 μm. (c) Enlarged view of the boxed region in (b) showing single-channel images and the composite image. The yellow arrowhead (bottom) indicates the association of a pre-synaptic terminal labelled by Sypb-EGFP (green, top) with a post-synaptic site labelled by Psd95-DsRedEx (red, middle). (d) Single optical section of the boxed region in (c) showing the fluorescence overlap of the pre- and post-synaptic punctum. (c,e–j) 2-h time series with a 20-min interval showing the overlap of pre- and post-synaptic labels (yellow arrowheads) is stably maintained. Time in minutes is indicated at the bottom right corner of each panel. Postsynaptic Psd95-DsRedEx puncta also showed dynamic behaviours: elimination (blue arrow), transient (magenta arrow), and formation (cyan arrow). Scale bar, 5 μm. |

Role of miR-132 in developmental synaptogenesis. (a) Lateral (left bottom) and dorsal (right) view of whole-mount in situ hybridization of miR-132 in zebrafish larvae at 3 dpf. The black arrows in left and right panels indicate the signal in the optic tectum and the RGC layer, respectively. Left top, whole-mount in situ hybridization of a scramble probe as a control. (b) Knockdown efficiency of miR-132 MO. Quantification of mature miR-132 in 3-dpf zebrafish larvae without MO injection or injected with either control or miR-132 MO by relative quantitative real-time PCR. Data were summarized from six independent experiments. n.s., no significant, ***P < 0.001 (One-way ANOVA and Tukey’s multiple comparison test). (c) Example of time series (from 96 hpf to 114 hpf) images showing the growth of Sypb-EGFP puncta on the same RGC axonal arbors in PGUSG larvae without MO injection or injected with either control or miR-132 MO. The dashed line indicates the position of the first branch point in each axonal arbor. R, rostral; L, lateral. Scale bar, 5 μm. (d) Summary of the net growth rate of Sypb-EGFP puncta from 96 hpf to 114 hpf. The numbers on the bars indicate the number of RGCs examined. n.s., no significant, **P < 0.01 (Two-tailed Unpaired Student’s t-test). |

DAPI staining of the retina in PGUSG larvae. (a) One optical section of confocal image of the retina with DAPI staining in a 3-dpf PGUSG larva. The nasal is upwards, the dorsal is leftwards. (b,c) Zoom-in and color separate view of the boxed region in (a). We chose three sections of each retina to count the number of Sypb-EGFP positive RGCs and DAPI-stained RGCs. Taking DAPI-stained RGCs as total RGCs, we found that 14.5 ± 0.5% (mean ± s.e.m.) of the RGCs were EGFP-positive in PGUSG at 3 dpf. As ~ 50% of RGCs could be labelled by the pou4f3 driver25, our PGUSG lines can at most label ~ 30% of pou4f3-positive RGCs. The calculation was based on data obtained from 3 larvae. Scale bar, 5 μm. |

Validation of Psd95-DsRedEx as a postsynaptic marker. (a) DsRed (top, red) and SV2 (middle, green) immunostaining of a thin horizontal cryostat section (20 μm in thickness) from a 4-dpf larva with tectal neurons sparsely labelled by Psd95-DsRedEx. M, medial; R, rostral. Scale bar, 5 μm. (b) Zoom-in views of three examples of anti-DsRed puncta (yellow arrowheads in a) juxtaposing with anti-SV2 puncta. Scale bar, 2 μm. (c) Spatial profile of the normalized immunofluorescence intensity of the three juxtapositions along the yellow dotted lines shown in (b). (d) Summary of the percentage of anti-DsRed puncta juxtaposing with anti-SV2 puncta. The juxtaposition is defined as immunofluorescence intensity overlap > 50%. The data were obtained from 7 cells in 3 larvae. |

Example of simultaneous imaging of pre- and postsynaptic sites of retinotectal synapses. (a) First image of a time-lapse series showing Psd95-DsRedEx labelled postsynaptic sites in the dendritic arbor of a tectal neuron (red) and the Sypb-EGFP labelled presynaptic terminals on the axonal arbor of multiple RGCs (green) in a 4-dpf PGUSG larva with transient expression of elavl3:psd95-DsRedEx. The nasal is upwards. Scale bar, 10 μm. (b) Enlarged view of the boxed region in (a). Scale bar, 5 μm. (c) Enlarged single optical section of the boxed region in (b) showing single-channel images and the composite image. The yellow arrowhead (bottom) indicates the association of a presynaptic terminal labelled by Sypb-EGFP (green, top) with a postsynaptic site labelled by Psd95-DsRedEx (red, middle). Scale bar, 5 μm. (c-i) 2-h time series at 20 min intervals showing the long-term stable overlap of pre- and postsynaptic labels (yellow arrowhead). Single optical section of the same area as in (c) was shown. Time in minutes is indicated in the bottom right corner of each panel. |