
- Title
-
Pharmacologic rescue of hyperammonemia-induced toxicity in zebrafish by inhibition of ornithine aminotransferase
- Authors
- Zielonka, M., Breuer, M., Okun, J.G., Carl, M., Hoffmann, G.F., K�lker, S.
- Source
- Full text @ PLoS One

ZFIN is incorporating published figure images and captions as part of an ongoing project. Figures from some publications have not yet been curated, or are not available for display because of copyright restrictions. PHENOTYPE:
|

Cerebral expression patterns of glutamine synthetase isoforms during zebrafish development. Localization of mRNAs encoding for the glutamine synthetases GLULA, GLULB and GLULC in the CNS of zebrafish larvae as visualized by ISH. Pictures are representative images of 3 independent experiments (n = 50 embryos/larvae per stage and experiment). Images show the embryonic heads at stages indicated. Left columns of each row show latter with anterior to the left and right columns with anterior to the top; FB, forebrain; MB, midbrain. Glula was expressed in radial glia (arrowheads) starting at 3 dpf with constantly increasing expression up to 5 dpf (A). Glulb was expressed in neural crest and neuromast cells (arrowheads) (B), Glulc expression was restricted to distinct cells of the nostrils (arrowheads) throughout indicated stages (C). |
|
ZFIN is incorporating published figure images and captions as part of an ongoing project. Figures from some publications have not yet been curated, or are not available for display because of copyright restrictions. |
|
ZFIN is incorporating published figure images and captions as part of an ongoing project. Figures from some publications have not yet been curated, or are not available for display because of copyright restrictions. PHENOTYPE:
|
|
ZFIN is incorporating published figure images and captions as part of an ongoing project. Figures from some publications have not yet been curated, or are not available for display because of copyright restrictions. |
|
ZFIN is incorporating published figure images and captions as part of an ongoing project. Figures from some publications have not yet been curated, or are not available for display because of copyright restrictions. |
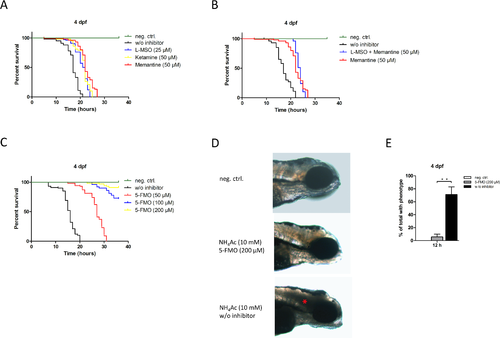
Comparison of different therapeutic concepts: OAT-inhibition prevents mortality in acute hyperammonemia and rescues brain cell death. Zebrafish larvae (n = 100 per group) at 4 dpf were treated with L-MSO (25 ?M), ketamine (50 ?M), or memantine (50 ?M) alone or in combination or with increasing concentrations of 5-FMO (50 to 200 ?M) for 30 minutes following exposure to 10 mM NH4Ac. While mock-treated zebrafish larvae died within 21 h (median survival: 17 h), larvae preincubated with L-MSO or ketamine succumbed to 10 mM NH4Ac within 24 h (median survival: 21.5 h; log-rank test, P<0.01) or 25 h (median survival: 22 h; log-rank test, P<0.01), respectively. Treatment with memantine prolonged survival up to 27 h (median survival 22h; log-rank test, P<0.01) (A). Combination of L-MSO and memantine did not further increase survival rates as compared to the treatment with memantine alone (B). Treatment with 50 ?M 5-FMO for 30 min prior to NH4-exposure prolonged survival up to 31 h (median survival: 27 h; log-rank test, P<0.0001). Further dosage escalation had an incremental benefit on survival rates. While 72% of larvae treated with 100 ?M 5-FMO survived the observation period of 36 h of NH4Ac exposure, treatment with 200 ?M 5-FMO increased the survival rate of exposed larvae to 91% (C). Representative illustration of zebrafishes at 4 dpf either treated with 200 ?M 5-FMO or mock (w/o inhibitor) for 30 min prior to exposure to 10 mM NH4Ac for 12 h (n = 3 with 50 larvae per group and experiment) (D). Zebrafishes were fixed with 5% PFA in PBS overnight and imaged using a binocular microscope (MZ16 F, Leica). Pictures show larvae with anterior to the right. Exposure to 10 mM NH4Ac induced brain cell death (asterix), which was rescued by treatment with 5-FMO in a concentration of 200 ?M as compared to the non-exposed control cohort (D). Quantitative analysis of larvae exhibiting signs of brain damage in the different groups (E). Data are expressed as mean +/- SD in % of total exhibiting microscopic signs of brain cell death (n = 3 with 50 larvae per group and experiment; ANOVA, **P<0.01). PHENOTYPE:
|
|
ZFIN is incorporating published figure images and captions as part of an ongoing project. Figures from some publications have not yet been curated, or are not available for display because of copyright restrictions. |