
FIGURE SUMMARY
- Title
-
Imaging Melanin Distribution in the Zebrafish Retina Using Photothermal Optical Coherence Tomography
- Authors
- Lapierre-Landry, M., Huckenpahler, A.L., Link, B.A., Collery, R.F., Carroll, J., Skala, M.C.
- Source
- Full text @ Transl Vis Sci Technol
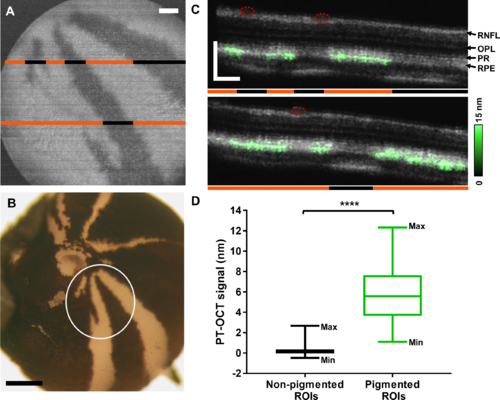
PT-OCT of melanin in tyrosinase-mosaic zebrafish. (A) En face OCT image of the RPE showing the pigmentation pattern. Areas of pigment are hyperreflective (white) while nonpigmented areas are hyporeflective (dark). (B) Posterior view of the eyecup. White circle indicates field of view shown in (A) where areas of pigment are dark and nonpigmented areas are white. (C) OCT (gray) and PT-OCT (green, overlaid) B-scans of the retina. The locations of the B-scans are indicated by the lines in (A). Orange lines denote pigmented areas and black lines denote nonpigmented areas. Red circles indicate presence of blood vessels. (D) Average PT-OCT signal for all nonpigmented and pigmented ROIs across n = 4 eyes from four zebrafish. Each ROI is 10 A-scans wide. Whiskers on the box plot show minimum and maximum values for each distribution. ****P < 0.0001 Student's t-test. RNFL, retinal nerve fiber layer; OPL, outer plexiform layer; PR, photoreceptors. Scale bar: 100 μm for OCT and 500 μm for histology.
|

PT-OCT signal of melanin increases linearly with power and is indicative of melanin concentration. (A) OCT B-scans (grayscale, left) of a tyrosinase-mosaic zebrafish retina with corresponding PT-OCT signal (overlaid in green on the left, signal alone on the right) collected at the same location for different photothermal laser powers (0–4.3 mW). Example ROIs 1, 2, and 3 indicated by arrows. Each ROI is composed of 10 adjacent A-scans. (B) Average PT-OCT signal for each ROI as a function of photothermal laser power. Error bars: standard error across 10 adjacent A-scans. Linear fits for each ROI 1, 2, and 3 with equations y = 0.74x (R2 = 0.96, SSR = 0.24), y = 0.02x (R2 = −0.35, SSR = 0.05), and y = 1.15x (R2 = 0.98, SSR = 0.23), respectively. (C) OCT B-scan (top), melanin absorption bar corresponding to the slopes extracted in (B) (middle) and corresponding PT-OCT B-scan (bottom), with location of ROIs indicated by arrows. Red circles indicate blood vessels. (D) Melanin absorption bar overlaid onto en face OCT images of the RPE for four different eyes. Melanin absorption is normalized for each eye. ROIs where the PT-OCT signal did not behave as predicted by theory (slope < −0.1, R2 < 0.5 and SSR > 1) are excluded for the melanin absorption (empty space). Scale bar: 100 μm.
|
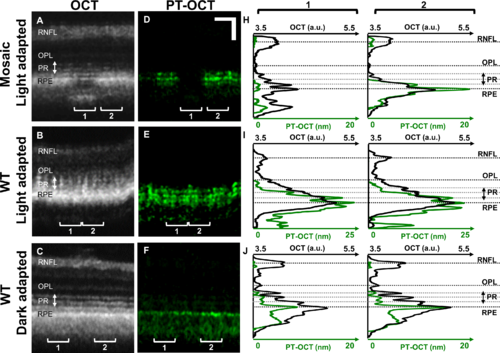
OCT and PT-OCT signal in the zebrafish retina as a function of depth. OCT (A–C) and PT-OCT (D–F) B-scans of light-adapted tyrosinase-mosaic zebrafish (top), WT light-adapted zebrafish (middle), and WT dark-adapted zebrafish (bottom) with LRP (OCT, black) and LAP (PT-OCT, green) for each ROI (H–J) 1 (left) and 2 (right). Each ROI is averaged over 20 adjacent A-scans. In (H), ROI 1 is nonpigmented, and ROI 2 is pigmented. Scale bar: 50 μm.
|

PT-OCT signal in light-adapted and dark-adapted WT zebrafish. (A) OCT and PT-OCT B-scan of a light-adapted and (B) dark-adapted zebrafish (PT-OCT signal overlaid in green onto the OCT signal on the left, PT-OCT alone on the right). Scale bar: 50 μm. (C) LRP (OCT, black) and LAP (PT-OCT, green) for five light-adapted zebrafish and (D) five dark-adapted zebrafish. Horizontal dashed lines correspond to the PT-OCT intensity peaks. Solid gray area indicates PR. Δx1 and Δx2 indicate distances between PT-OCT peaks in the light-adapted zebrafish. (E) PT-OCT power spectrum obtained from the 10 light-adapted (red) and 11 dark-adapted (blue) zebrafish. Solid line: mean; shaded region: standard deviation. The spatial frequencies corresponding to 1/Δx1 and 1/Δx2 are indicated. (F) Average PT-OCT signal per eye for all dark-adapted (blue) and light-adapted zebrafish (red). Error bars: standard deviation. ****P < 0.0001 Student's t-test.
|

Melanosome migration observed in histology sections. (A, B) OCT and (C, D) corresponding PT-OCT B-scans with (E, F) corresponding H&E histology sections from the same animal for both light-adapted (A, C, E) and dark-adapted (B, D, F) zebrafish. White arrowheads indicate different structures where melanin is present (coregistered between images A and C, and B and D, approximate location for images E and F). Scale bar: 50 μm for OCT and PT-OCT images, 25 μm for histology. INL, inner nuclear layer; ISe, photoreceptor inner segment ellipsoid zone; OS, photoreceptor outer segment.
|
Acknowledgments
This image is the copyrighted work of the attributed author or publisher, and
ZFIN has permission only to display this image to its users.
Additional permissions should be obtained from the applicable author or publisher of the image.
Full text @ Transl Vis Sci Technol