
- Title
-
Colony-Stimulating Factor 1 Receptor (CSF1R) Regulates Microglia Density and Distribution, but Not Microglia Differentiation In Vivo
- Authors
- Oosterhof, N., Kuil, L.E., van der Linde, H.C., Burm, S.M., Berdowski, W., van Ijcken, W.F.J., van Swieten, J.C., Hol, E.M., Verheijen, M.H.G., van Ham, T.J.
- Source
- Full text @ Cell Rep.

Microglia Numbers during Development Are csf1r Dosage-Dependent (A) Counts per million (CPM) expression values of csf1ra and csf1rb from our previous RNA sequencing study in adult zebrafish microglia (Oosterhof et al., 2017). (B) Schematic representation of the csf1rb mutation introduced with TALEN-mediated genome editing. (C and D) 5 days post fertilization (dpf), WT, csf1ra−/−, csf1rb−/−, csf1ra−/−;b+/−, and csf1rDM larvae were treated with neutral red for 2.5 hr. Images were acquired with a stereomicroscope, and microglia numbers were determined by counting the number of neutral red dots. n is at least 15 zebrafish/genotype for (C) and at least 7 for (D). (E) 4 dpf, WT, csf1ra−/−, csf1ra−/−;b+/− and csf1rDM were labeled with an antibody against L-plastin (Spangenberg et al., 2016), and L-plastin-positive cells were quantified in the optic tecti. n is at least 6 zebrafish/genotype. LBD, ligand-binding domain; TMD, transmembrane domain; TKD, tyrosine kinase domain. Error bars represent SD. ∗∗p < 0.01, ∗∗∗p < 0.001 (one-way ANOVA, Bonferroni multiple testing correction). Scale bar, 40 μm. |
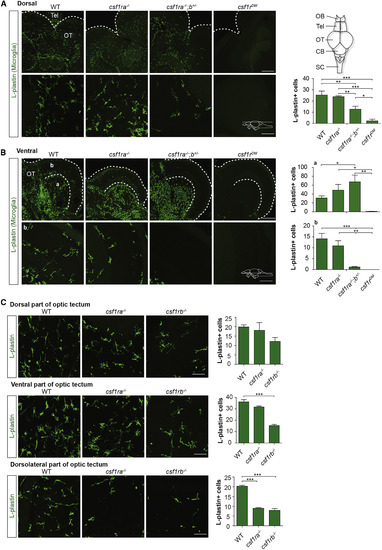
Altered Microglia Distribution and Numbers in the Adult csf1r Mutant Brain (A) Representative images of microglia in WT, csf1ra−/−, csf1ra−/−;b+/−, and csf1rDM brain sections from zebrafish aged 5 months post fertilization (mpf), stained with antibody against L-plastin (n = 3 zebrafish/group). (B) Microglia in (a) the ventral part of the optic tectum and (b) the dorsolateral part of the optic tectum of WT, csf1ra−/−, csf1ra−/−;b+/−, and csf1rDM. (C) Representative images of microglia in WT, csf1ra−/−, and csf1rb−/− brain sections from 15 mpf zebrafish stained with antibody against L-plastin (n = 3 zebrafish/group). Microglia were quantified in 3 areas (2.5 × 106 μm3) per brain region per animal. Error bars represent SD. ∗p < 0.05, ∗∗p < 0.01, ∗∗∗p < 0.001 (one-way ANOVA, Bonferroni multiple testing correction). Scale bars in (A) and (B), top, indicate 200 μm; in (A) and (B), bottom, and in (C), scale bars indicate 50 μm. |
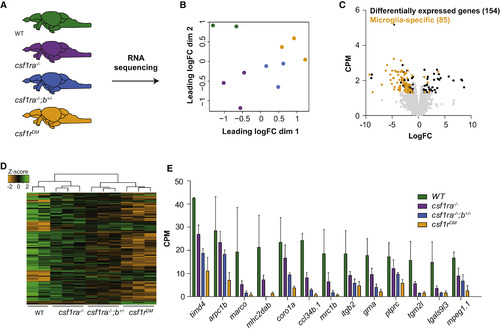
RNA Sequencing Reveals No Signs of Brain Pathology in csf1r Mutant Zebrafish (A) Schematic representation of the whole-brain RNA sequencing experiment. RNA was isolated from whole brains of WT, csf1ra−/−, csf1ra−/−;b+/−, and csf1rDM fish (3 brains per sample, 2–3 samples per genotype). (B) Multidimensional scaling plot. (C) Volcano plot with genes differentially expressed between csf1rDM and WT fish. Yellow dots represent genes that are part of the zebrafish microglia transcriptome (Oosterhof et al., 2017). Black dots represent the other differentially expressed genes. Gray dots represent all detected genes. (D) Heatmap with genes differentially expressed between csf1rDM and WT fish genes. (E) Expression values of differentially expressed microglia-specific genes. Genes were differentially expressed with false discovery rate (FDR) < 0.05 and log fold change (LogFC) > |1|. |
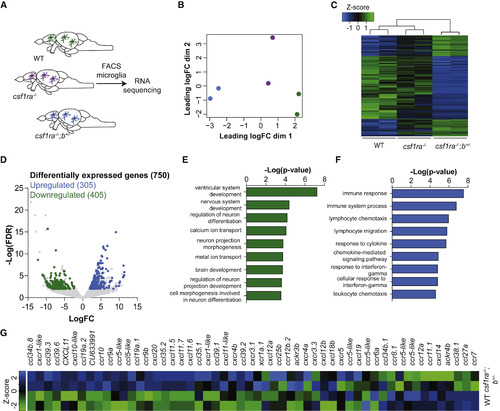
RNA Sequencing Reveals Increased Expression of Genes Associated with Chemotaxis in csf1ra−/−;b+/− Mutant Microglia (A) Schematic representation of the RNA sequencing experiment. Microglia were sorted by FACS from dissected brains from WT (3 brains per sample, 2 samples), csf1ra−/− (3 brains per sample, 2 samples), and csf1ra−/−;b+/− (4–5 brains per sample, 2 samples) zebrafish. (B) Multidimensional scaling plot. (C) Heatmap of differentially expressed genes between csf1ra−/−;b+/− and WT microglia. (D) Volcano plot of differentially expressed genes (csf1ra−/−;b+/− versus WT) whose expression values in csf1ra−/− mutants lay between those of WT and csf1ra−/−;b+/− mutants. (E and F) Gene ontology analysis was performed on genes that showed a csf1r-dependent decrease in expression (E) and increase in expression (F). (G) Heatmap with expression Z scores for all chemokines and chemokine receptors that are expressed in zebrafish microglia. Genes were differentially expressed with FDR < 0.01 and LogFC > |2|. Adult zebrafish used were between 9–12 months old. |
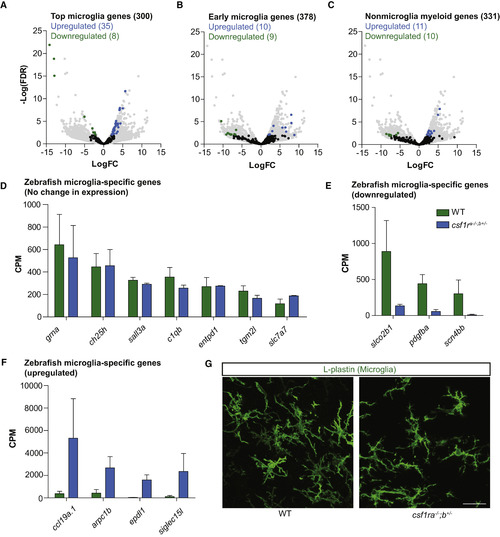
Differential Gene Expression of csf1r-Deficient Microglia Shows Normal Microglia Differentiation (A) Volcano plot showing expressional changes of the 300 most highly expressed microglia-specific genes in csf1ra−/−;b+/− mutant microglia (Oosterhof et al., 2017). (B) Volcano plot showing the expressional changes in csf1ra−/−;b+/− mutant microglia of normally downregulated genes during differentiation (Matcovitch-Natan et al., 2016) and of genes normally expressed in other macrophages in the CNS (Bennett et al., 2016). (C) Volcano plot showing the expression changes of non-microglia myeloid genes. (D) Expression values of zebrafish microglia-specific genes. (E) Expression values of downregulated microglia-specific genes. (F) Expression values of upregulated microglia-specific genes. (G) Representative images of microglia (5-month-old fish) in the ventral part of the optic tectum labeled with an antibody against L-plastin. Scale bar, 20 μm. EXPRESSION / LABELING:
|
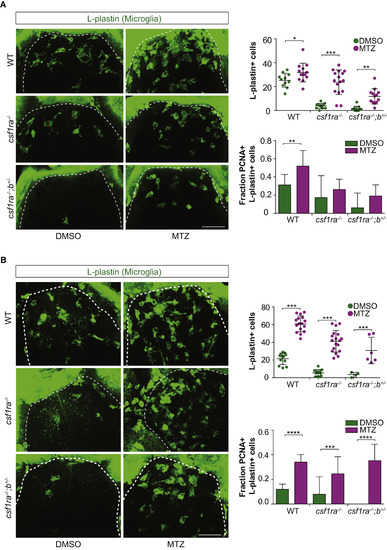
The Response to Neuronal Cell Death of csf1r Mutant Microglia Depends More on Recruitment Than on Proliferation (A and B) We used our previously described conditional neuronal ablation model (van Ham et al., 2012, van Ham et al., 2014), in which treatment with metronidazole (MTZ) leads to selective ablation of neurons with transgenic expression of NTR (the nsfB gene encoding NTR). WT, csf1ra−/−, and csf1ra−/−;b+/− larvae were treated with MTZ at 5 dpf for 16 hr and fixed for immunohistochemistry (whole-mount) at 6 dpf (A) and 7 dpf (B). Immunostaining was performed for dividing (Pcna+) microglia (L-plastin+), and the entire forebrain (dotted lines) was imaged and quantified. Scale bars, 40 μm. Group sizes were at least n = 10 zebrafish larvae (A) and at least n = 4 (B). Error bars indicate SD. ∗p < 0.05, ∗∗p < 0.01, ∗∗∗p < 0.001, ∗p < 0.0001 (one-way ANOVA, Bonferroni multiple testing correction). |

Csf1r-deficient zebrafish have intestinal- and skin macrophages. Related to Fig. 2. A Schematic representation of csf1rb mutation. TALEN sequences are highlighted in blue. Restriction site for genotyping is highlighted in yellow. E = exon. B L-plastin labeled macrophages in the intestine of 4.5 month-old zebrafish. C mpeg:GFP+ macrophages in the skin of control and csf1rDM adult zebrafish of 4.5 month-old zebrafish. Scale bar = 100 μm (B) |
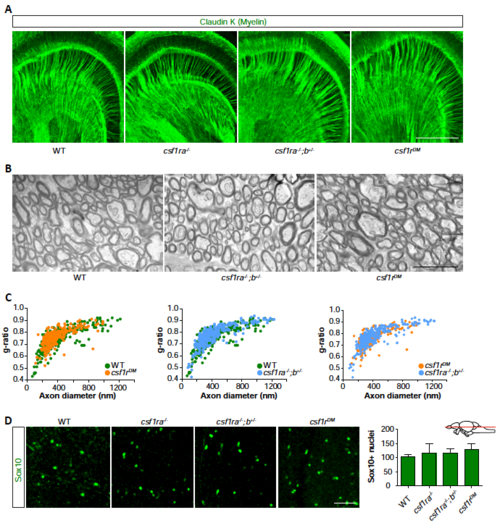
No signs of white matter pathology in csf1r mutant zebrafish. Related to Fig. 2. A Representative images of 5-month-old WT (n=3), csf1ra-/- (n=3), csf1ra-/-;b+/- (n=3) and csf1rDM (n=3) zebrafish brain sections stained with an antibody against ClaudinK (myelin). B Electron microscopy was performed on the dissected brains of WT (n=3), csf1ra-/-;b+/- (n=3) and csf1rDM (n=3) zebrafish (5 mpf). Representative images of myelin in WT, csf1ra-/-;b+/- and csf1rDM. C. Morphometric analysis of axons in brains of WT and csf1ra-/-;b+/- and csf1rDM mutant zebrafish, showing g-ratio (axon diameter/myelinated fiber diameter) at 5 months of age. Mean gratio’s presented as mean ± SEM were 0.74 +/- 0.01 for controls, 0.76+/- 0.01 for csf1ra-/-;b+/- and 0.77 +/- 0.0 for csf1rDM and did not differ between genotypes according to t-test (p = 0.22, 0.12 and 0.34 respectively). D Representative images of Sox10 (oligodendrocyte lineage cells) antibody labeling in deep brain regions of zebrafish. Adult zebrafish, aged 5 mpf, were used in A, B and C and aged 15 mpf in D. B Scale bars represent 200 μm (A), 1 μm (B), 40 μm (D). Each group in (C.) consisted of two to three zebrafish brains, and contained at least 240 myelinated fibers per genotype. PHENOTYPE:
|