
- Title
-
Eyes shut homolog is important for the maintenance of photoreceptor morphology and visual function in zebrafish
- Authors
- Messchaert, M., Dona, M., Broekman, S., Peters, T.A., Corral-Serrano, J.C., Slijkerman, R.W.N., van Wijk, E., Collin, R.W.J.
- Source
- Full text @ PLoS One

Characterization of a stable eysrmc101/rmc101 zebrafish line. (A) Sanger sequencing identified a five base pair deletion in exon 20 in eysrmc101/rmc101 zebrafish. (B) Representative gel image of RT-PCR analysis using RNA from a pool of larvae (n = 15), which shows that eys transcripts are present in both wild-type and eysrmc101/rmc101 zebrafish (upper panel). Sanger sequencing confirmed the presence of the five base pair deletion in the eysrmc101/rmc101 transcript (lower panel). (C) Protein domain structures of wild-type Eys and the truncated Eys protein that is predicted in eysrmc101/rmc101 zebrafish. EXPRESSION / LABELING:
|
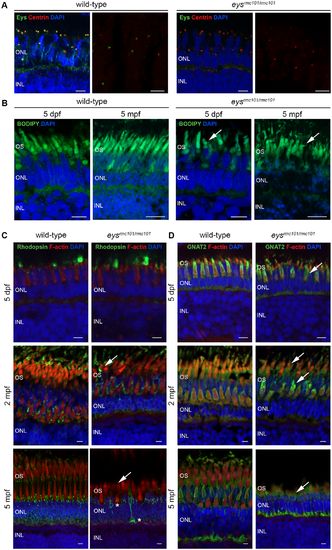
Immunohistochemistry on retinal sections of wild-type and eysrmc101/rmc101 zebrafish. (A) Retinal sections of wild-type and eysrmc101/rmc101 zebrafish at 5 dpf and 5 mpf stained with antibodies against Eys (green) and centrin (red). (B) BODIPY (green) staining showing disorganization of photoreceptor outer segments in eysrmc101/rmc101 zebrafish (5 dpf and 5 mpf) compared to age- and strain-matched wild-type zebrafish (arrows). (C) Retinal sections of wild-type and eysrmc101/rmc101 zebrafish at 5 dpf (upper panel), 2 mpf (middle panel) and 5 mpf (lower panel) stained with antibodies against rhodopsin (green) and F-actin (red). Asterisks indicate mislocalization of rhodopsin to the inner segments and synapses of photoreceptor cells. (D) Retinal sections of wild-type and eysrmc101/rmc101 zebrafish at 5 dpf, 2 mpf and 5 mpf stained with antibodies against GNAT2 (green) and F-actin (red). Arrows indicate dysmorphic outer segments in mutant zebrafish. In all images, nuclei are counterstained with DAPI (blue). INL: inner nuclear layer; ONL: outer nuclear layer; OS: outer segments. Scale: 5 μm. |

Visual function of wild-type and eysrmc101/rmc101 zebrafish larvae. (A) ERG measurements of the b-wave of wild-type (black line) and eysrmc101/rmc101 (red line) zebrafish larvae at 5 dpf. (B) ERG measurements of the a-wave of wild-type (black line) and eysrmc101/rmc101 (red line) zebrafish larvae at 5 dpf. (C) Quantification of the ERG b-wave amplitude of wild-type and eysrmc101/rmc101 zebrafish larvae at 5 dpf (n = 30; p = 0.0004). (D) Quantification of the ERG a-wave amplitude of wild-type and eysrmc101/rmc101 zebrafish larvae at 5 dpf (n = 20; p = 0.2324). (E) Optokinetic response measurements of wild-type and eysrmc101/rmc101 larvae at 5 dpf (n = 19). PHENOTYPE:
|
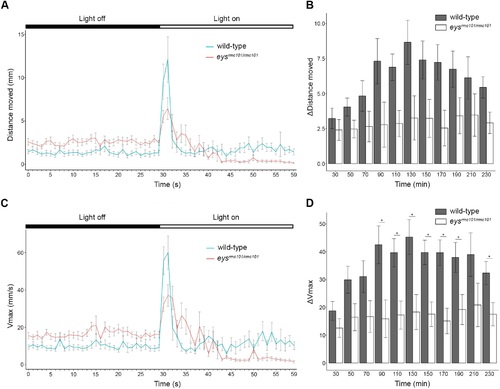
Visual motor response of zebrafish larvae. (A) Distance moved (mm) of wild-type (blue line) and eysrmc101/rmc101 (red line) larvae in response to a light stimulus (dark-to-light transition at t = 50 minutes). (B) Comparison of difference in distance moved between wild-type and eysrmc101/rmc101 larvae at the dark to light transition zones. (C) Maximum velocity (Vmax; mm/s) of wild-type (blue line) and eysrmc101/rmc101 (red line) larvae in response to a light stimulus (dark-to-light transition at t = 50 minutes). (D) Comparison of difference in Vmax between wild-type and eysrmc101/rmc101 larvae at the dark to light transition zones. All experiments were done with larvae at 5 dpf (n = 120). Statistical significance (p<0.05) is indicated with an asterisk. PHENOTYPE:
|
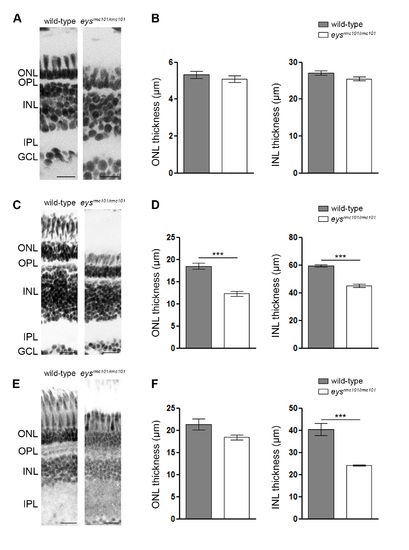
Measurement of the thickness of outer and inner nuclear layers in eysrmc101/rmc101 and wild-type zebrafish. (A, C, E) Representative images of wild-type and eysrmc101/rmc101 zebrafish retinas at (A) 5 dpf, (C) 2 mpf, and (E) 5 mpf. Nuclear layers were stained with DAPI and inverted to grey images. ONL: outer nuclear layer; OPL: outer plexiform layer; INL: inner nuclear layer; IPL: inner plexiform layer; GCL: ganglion cell layer. Scale bars (A): 10 μm. Scale bars (C, E): 20 μm. (B, D, F) Measurements of ONL and INL thickness in wild-type and eysrmc101/rmc101 zebrafish at (A) 5 dpf, (C) 2 mpf, and (E) 5 mpf. Asterisks indicate statistical significance (*** = p<0.0001) using Mann-Whitney U test. |
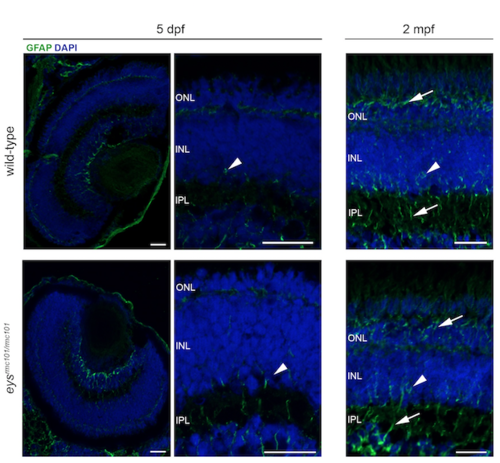
Immunohistochemistry on retinal sections of wild-type and eysrmc101/rmc101 zebrafish in order to investigate Müller glia activation. Retinal sections of wild-type and eysrmc101/rmc101 zebrafish at 5 dpf and 2 mpf stained with antibodies against GFAP (green), as a marker for Müller glia cells. Müller glia cell bodies are located in the inner nuclear layer (arrow heads) and project processes (arrows) in either direction to outer limiting membrane and inner limiting membrane. Nuclei are counterstained with DAPI (blue). INL: inner nuclear layer; IPL: inner plexiform layer; ONL: outer nuclear layer. Scale bar: 20 μm. EXPRESSION / LABELING:
PHENOTYPE:
|