
- Title
-
Fish Scales Dictate the Pattern of Adult Skin Innervation and Vascularization
- Authors
- Rasmussen, J.P., Vo, N.T., Sagasti, A.
- Source
- Full text @ Dev. Cell
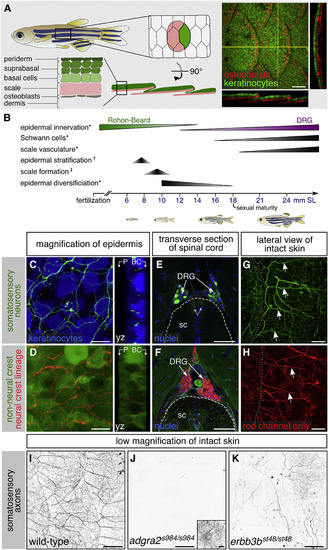
Adult Epidermal Innervation Requires Erbb3b and Adgra2 (A) Left, diagram of adult skin anatomy. Right, confocal projection and orthogonal views through the lateral trunk. Yellow lines, planes of orthogonal sections. In this and subsequent lateral views, posterior is to the right. (B) Timeline of trunk skin development with approximate timing of major morphogenetic events. See Figure S3A for timing of differentiation of club cells, a specialized cell type within the fish epidermis (Whitear, 1986). ∗shown in this study; †based on (Guzman et al., 2013); ‡based on (Sire et al., 1997a). (C and D) Projections and orthogonal views through the epidermis of isolated scales. P, periderm; BC, basal cells. (E and F) Transverse sections through the mid-trunk. In this region, DRGs are located dorsal to the spinal cord (Weis, 1968). Double-headed arrows, DRG central axons within the spinal cord (sc). Dashed lines, spinal cord boundary. (G and H) Lateral views of intact adult trunk skin. Dashed lines, scale margins. Arrows, superficial axon bundles above scales. (I–K) Representative images of lateral trunk skin from adults of indicated genotypes. Inset in (J), trigeminal sensory axons over the eye to confirm presence of transgene. Transgenes: (A) keratinocytes (Tg(krt4:EGFP)) (Rasmussen et al., 2015) and osteoblasts (Tg(sp7:mCherry-nfsB)) (Singh et al., 2012); (C) keratinocytes (Tg(actb2:BswitchR)) (Kobayashi et al., 2014); (C, E, and G) and somatosensory neurons (Tg(p2rx3b:EGFP)) (Kucenas et al., 2006); (D, F, and H) Tg(-28.5Sox10:Cre);Tg(ubb:GswitchR) (Kague et al., 2012, Mosimann et al., 2011); (I–K) somatosensory axons (Tg(p2rx3a>mCherry)) (Palanca et al., 2013). Staining: (E and F) nuclei (DAPI). Scale bars, 100 μm (A and E–H), 10 μm (C and D), and 250 μm (I–K). See also Figures S1 and S2. |

Remodeling of Skin Innervation during Juvenile Development (A) Adult scale removed from animal and immunostained for indicated structures. Note that the posterior region is covered by epidermis (green). (B) Measurements of scale size during late juvenile stages. n = 8–12 scales/stage. Black bars, mean ± SEM. (C) Representative scales from juvenile animals immunostained at the indicated stages. Magnifications of epidermis are shown in C′. Note that elongated tracts form before nerves enter the scale. (D) Representative scales from juvenile erbb3b−/− and sibling controls. Note that in erbb3b−/− scales axon bundles never form, and innervation is lost by 18 mm SL. Arrows in (A), (C) and (D) indicate superficial axon bundles. (E–H) Quantification of axon density near the skin (E and G) and superficial axon bundles (F and H) based on acTubulin staining. n = 4–12 scales/sample (mean sample size = 9.7). Black bars, mean ± SEM. ∗p < 0.01, Wilcoxon rank-sum test. Staining: (A, C, and D) F-actin (phalloidin), axons (acTubulin) and nuclei (DAPI). Scale bars, 250 μm (A), 100 μm (C and D), and 25 μm (C′). See also Figure S3. PHENOTYPE:
|
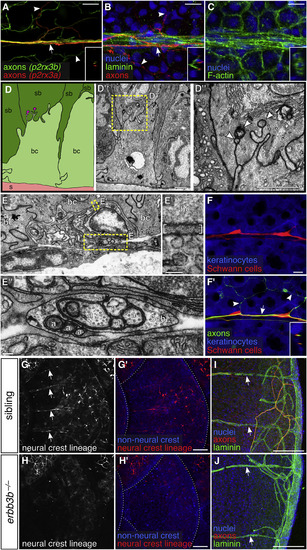
DRG Axons Form Nerves at the Surface of Scales (A–C) Projections through a single superficial scale nerve in an adult. Arrow, axon bundle. Arrowheads, axon free endings. Insets, orthogonal views of nerve; outer surface to left. (D) TEM of scale epidermis. Arrowheads, axon free endings ensheathed by keratinocyte membranes. Yellow box, area of magnification. (E) Transverse TEM of superficial scale nerve. Yellow boxes, areas of magnification. Brackets in E′ indicate electron dense extracellular material. a, axon; Sch, Schwann cell; bc, basal cell; sb, suprabasal cell; s, scale. (F) DRG axons and associated Schwann cells (arrow in F′) along the scale surface. Note that free endings in the epidermis (arrowheads) are not associated with Schwann cells. Inset, orthogonal view of nerve. (G and H) Representative lateral views of the trunk of adult erbb3b−/− and sibling controls. Arrows, scale nerve-associated Schwann cells. Dashed lines, scale margins. (I and J) Representative scales from adult erbb3b−/− and sibling controls immunostained for indicated markers. Arrows, superficial laminin tracts. Transgenes: (A) Tg(p2rx3b:EGFP) and Tg(p2rx3a>mCherry) (these two transgenes label nociceptive sensory neurons, but, as in larvae, P2rx3a appears to label a subset of P2rx3b neurons; Gau et al., 2013, Palanca et al., 2013); (F) axons (Tg(p2rx3b:EGFP)), and keratinocytes and Schwann cells (Tg(-28.5Sox10:Cre);Tg(actb2:BswitchR)); (G and H) Tg(-28.5Sox10:Cre);Tg(actb2:BswitchR). Staining: (B, I, and J) laminin (anti-laminin), axons (acTubulin), and nuclei (DAPI); (C) F-actin (phalloidin) and nuclei (DAPI). Scale bars, 10 μm (A–C and F), 1 μm (D and E), 0.1 μm (E′ and E″), and 100 μm (G–J). |
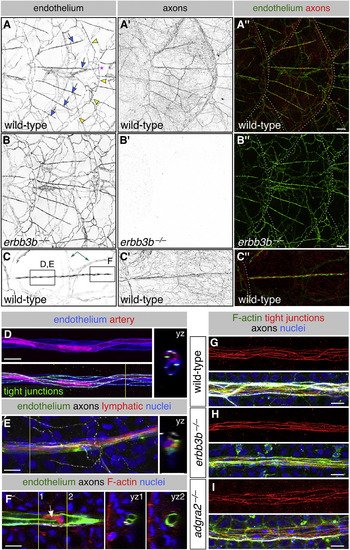
Scales Vascularize Independently of Sensory Axons (A–C) Representative lateral views of the trunk from wild-type and erbb3b−/− adults. Arrows, superficial scale capillaries. Arrowheads, microvasculature associated with scale margin. Asterisk, interconnection of superficial capillary with scale margin vasculature. Dashed lines, scale margins. Double-headed arrow, example of dermal vasculature not associated with sensory nerves. Boxes in (C) indicate areas of magnification for (D)–(F). (D and E) Magnification of scale capillaries. Note the two intertwined vessels in (D). (F) Single z section through the tip of a scale capillary. Orthogonal views show that vessel lumens merge near posterior tip to form a U shape. Arrow, cell within the vessel lumen. Yellow lines in (D)–(F), planes of orthogonal sections. (G–I) Representative scale capillaries immunostained for the indicated markers from adult wild-type, erbb3b−/− and adgra2−/− fish. Transgenes: endothelium (Tg(fli1a:EGFP)); (A–C) axons (Tg(p2rx3a>mCherry)); (D) artery (Tg(-0.8flt1:RFP)) (Bussmann et al., 2010); lymphatic (TgBAC(prox1a:KALTA4,4xUAS-ADV.E1b:TagRFP)) (van Impel et al., 2014). Staining: (D) tight junctions (anti-Tjp1); (E) axons (acTubulin) and nuclei (DAPI); (F) F-actin (phalloidin), axons (acTubulin), and nuclei (DAPI); (G–I) F-actin (phalloidin), tight junctions (anti-Tjp1), axons (acTubulin), and nuclei (DAPI). Scale bars, 100 μm (A–C) and 10 μm (D–I). See also Figure S4. |
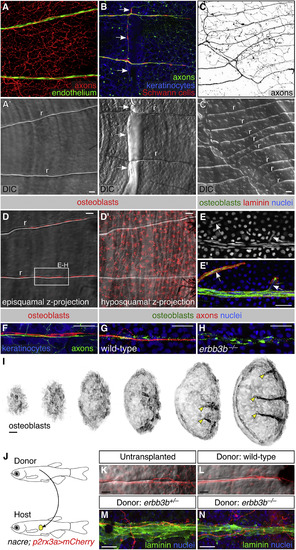
Neurovascular Congruence with Radial Osteoblasts. (A–C) Fluorescent and differential interference contrast (DIC) images showing congruence between nerves and scale radii in wild-type animals. r, radius. Arrows, areas of nerve-radius congruence. In (C), the scale was from a 2-year-old, 31 mm SL fish. r, radius. (D) Episquamal osteoblasts localize along radii. (E) Scale nerve immunostained as indicated. Note the close apposition between osteoblasts and laminin staining. Arrows, single osteoblast nuclei. (F) Congruence between episquamal osteoblasts and scale nerve. (G and H) Representative scale nerves from adult wild-type and erbb3b−/− fish immunostained for indicated markers. Note that radial osteoblasts form normally in the absence of axons. (I) Lateral views of nascent scales imaged from the anterior region of an intact animal at stage 10 mm SL (43 days post fertilization). Scales develop asynchronously from posterior to anterior (Sire et al., 1997a). Individual scales from adjacent regions of the body were cropped and ordered by size to create this composite. Note that radial osteoblasts first appear near the posterior scale margin (arrowheads). (J) Schematic of scale transplant experiments. (K and L) Widefield images of untransplanted control (K) and transplanted (L) scales showing sensory axons along a single radius. Images show overlays of the mCherry and DIC channels. (M and N) Immunostaining of transplanted scales from donor fish of the indicated genotypes. Laminin staining marks the radii. Note growth of host axons along the donor radii. Transgenes: (A) endothelium (Tg(fli1a:EGFP)) and axons (Tg(p2rx3a>mCherry)); (B) axons (Tg(p2rx3b:EGFP)), and keratinocytes and Schwann cells (Tg(-28.5Sox10:Cre);Tg(actb2:BswitchR)); (C) Tg(p2rx3a>mCherry); (D) Tg(sp7:mCherry-nfsB); (F) axons (Tg(p2rx3b:EGFP)), osteoblasts (Tg(sp7:mCherry-nfsB)), and keratinocytes (Tg(actb2:BswitchR)); (I) Tg(sp7:mCherry-nfsB). Staining: (E) osteoblasts (zns-5), laminin (anti-laminin), and nuclei (DAPI); (G and H) osteoblasts (zns-5), axons (acTubulin), and nuclei (DAPI); (M and N) laminin (anti-laminin) and nuclei (DAPI). Scale bars, 25 μm. See also Figures S5 and S6. |
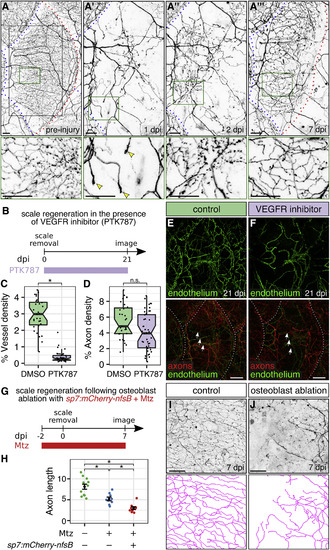
Osteoblasts, but Not Blood Vessels, Promote Epidermal Re-innervation following Injury (A) Regeneration of a single scale and associated axons. Black box, region of images in (A′)–(A‴). Green boxes, regions of magnification in lower panels. Red dashed lines, scale margins before and after removal. Blue dashed lines, margins of non-injured scales. Note that regenerating axons developed growth cones in the dermis at 1 dpi (arrowheads), sparsely innervated the epidermis at 2 dpi, and more extensively innervated the epidermis at 7 dpi. (B) Experimental design for scale regeneration in the presence of 500 nM PTK787. (C and D) Boxplots of vessel (C) and axon (D) density based on Tg(fli1a:EGFP) expression or acTubulin staining, respectively, in regenerating scales at 21 dpi. n = 31–44 scales from n = 2–3 fish. ∗p < 0.01; n.s., not significant (p > 0.01); Wilcoxon rank-sum test. (E and F) Representative lateral views of the indicated markers in control (DMSO) or VEGFR inhibitor (PTK787)-treated skin. Note that neither treatment prevented the formation or maintenance of nerves (arrows) over the course of the experiment. Dashed lines, scale margins. (G) Timeline of osteoblast ablation using metronidazole (Mtz). (H–J) Quantification (H) and representative lateral views and tracings (I and J) of regenerating axons in control or osteoblast-ablated fish (Mtz) at 7 dpi. Axon length is expressed as millimeters per 0.0625 mm2 region of skin. n = 9–12 regions/treatment from n = 2–3 fish. Black bars, mean ± SEM. ∗p < 0.01, Wilcoxon rank-sum test. Transgenes: (A) axons (Tg(p2rx3a>mCherry)); (E and F) axons (Tg(p2rx3a>mCherry)) and endothelium (Tg(fli1a:EGFP)); (I and J) axons (Tg(p2rx3b:EGFP)). Scale bars, 50 μm (A, I, and J) and 200 μm (E and F). See also Figure S5. |

Scales Organize Epidermal Sensory Innervation and Vascularization (A–D) Lateral views of wild-type and edankt/nkt mutant skin. Note the absence of scales in eda mutants. Boxes, areas of magnification for insets in (B) and (D). Axons and vasculature below the hypodermis are obscured by pigmentation, causing them to appear unconnected. (E and F) Lateral views of wild-type and fgfr1aspd/spd mutant skin and associated tracings (E″ and F‴). Arrows, scale orientation. Blue arrows, posterior-anterior oriented scales. Note in (E″) that nerves below scales (green) have a primarily dorsal-ventral orientation, whereas nerves above scales (magenta) have a primarily anterior-posterior orientation. Note reversed scale orientation (F) (blue arrows). (G and H) Lateral and orthogonal views of skin from adults of the indicated genotypes. Orange and blue shading in (G) and (H) indicates squamated and naked skin, respectively. Arrowheads in (H′) indicate axons in the dermis (De); brackets and dashed lines indicate epidermis. (G.a), (G.b), (H.a), and (G.b) are single z planes through the skin. (I) Boxplots of axon density based on quantification of Tg(p2rx3a>mCherry) expression in squamated and naked skin from animals of the indicated genotypes. Quantification includes all axons within the field of view (dermis and epidermis). ∗p < 0.01, Wilcoxon rank-sum test. n = 28–71 regions of 0.038–0.077 mm2 were analyzed per category. Transgenes: keratinocytes (Tg(krt4:EGFP)), axons (Tg(p2rx3a>mCherry)) and endothelium (Tg(fli1a:EGFP)). Scale bars, 100 μm (A–F′, G, G′, and H–H″) and 25 μm (insets in B and D; F″, G.a, G.b, H.a, and H.b). See also Figure S7. |

Organization of adult DRG peripheral axons, Related to Figure 1 (A) Lateral view of the adult trunk. Note the absence of the somatosensory axon reporter [Tg(p2rx3a>mCherry)] along the posterior lateral line nerve (pLLn), a sensory nerve that innervates neuromasts along the trunk. Arrows, superficial axon bundles. Dashed line, scale margin. (B-C) Maximum intensity projections through the basal epidermis of scales isolated from indicated transgenic lines that mark sensory neurons. Arrows, superficial axon bundles. (D) Maximum intensity projections through the basal epidermis of isolated scales immunostained as indicated. (E) Transverse vibratome section through the adult mid-trunk. Arrows, DRG cell bodies. Yellow arrowheads, DRG peripheral axons between myosepta. Dashed box, area of magnification. Doubleheaded arrows, DRG central axons within the dorsal spinal cord (sc). Dashed lines, spinal cord boundary. Transgenes: (A) somatosensory axons [Tg(p2rx3a>mCherry)] and myelinating Schwann cells [Tg(cldnk:GAL4);Tg(14xUAS:MA-GFP)] (Münzel et al., 2012); (B) Tg(Tru.Gap43:EGFP) (Udvadia, 2008); (C) TgBAC(trpa1b:EGFP) (Pan et al., 2012); (E) Tg(p2rx3a>mCherry). Staining: (D) axons (zn-12) (Metcalfe et al., 1990), axons (acTubulin), and nuclei (DAPI); (E) nuclei (DAPI). Scale bars, 250 μm (A,E), 25 μm (B-D) and 100 μm (E’’). |
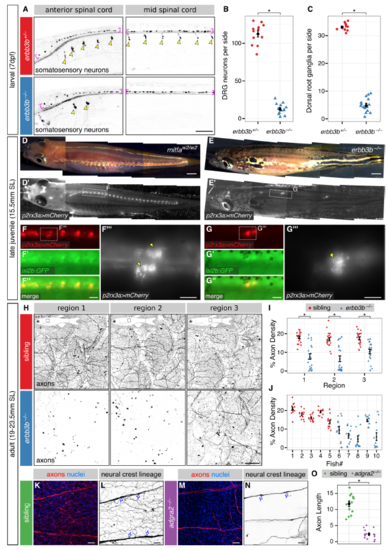
Erbb3b and Adgra2 are required for the development of most skin-innervating DRG neurons, Related to Figure 1 (A) Lateral views of the larval spinal cord. Arrowheads, DRG cell bodies. Brackets, RB cell bodies. (B,C) Quantification of the total number of Tg(-17.6isl2b:GFP)-expressing DRG neurons (B) and dorsal root ganglia (C) per one side of the fish. n=12-15 fish per genotype. Black bars, mean ± SEM. *, p<0.01, Wilcoxon rank sum test. (D,E) Dorsolateral brightfield and fluorescent images of juvenile fish. Dashed boxes indicate regions of magnification. mitfaw2/w2 animals lack melanophores (Lister et al., 1999) and were used to aid visualization of the spinal cord. (F,G) Fluorescent images along the rostral spinal cord. Dashed boxes indicate regions of magnification. Arrowheads indicate the bilateral ganglia in F’’’ and unilateral ganglion in G’’’. (H) Images of multiple regions of lateral trunk skin from individual erbb3b-/- and sibling adults. Insets, regions imaged. Note the non-uniform skin innervation in erbb3b-/- animals. (I,J) Quantification of Tg(p2rx3a>mCherry) axon density in lateral trunk skin. Imaged regions indicated in panel H. n=5 fish per genotype, twelve separate 0.25 mm2 regions were quantified per fish. Black bars, mean ± SEM. *, p<0.01, Wilcoxon rank sum test. (K-N) Projections through the epidermis of scales isolated from adgra2-/- and sibling adults. Note the sparse innervation by NC-derived axons in the adgra2-/- epidermis. These remaining axons are likely not nociceptive, because they do not express the nociceptive marker Tg(p2rx3a>mCherry) (see Figure 1J). Based on the distribution and morphology of these remaining endings, they do not penetrate to superficial strata nor do they appear to innervate Merkel cells. Arrows in panels L and N indicate Schwann cell bodies. (O) Quantification of epidermal axon length based on tracings of the neural crest lineage reporter in the indicated genotypes. n=13-15 scales isolated from n=3 fish per genotype. Axon length is expressed as mm/0.1 mm2. Black bars, mean ± SEM. *, p<0.01, Wilcoxon rank sum test. Transgenes: (A) Tg(-17.6isl2b:GFP) (Pittman et al., 2008); (D,E) Tg(p2rx3a>mCherry); (F,G) Tg(-17.6isl2b:GFP) and Tg(p2rx3a>mCherry); (H) Tg(p2rx3a>mCherry); (L,N) Tg(-28.5Sox10:Cre);Tg(ubb:GswitchR) (red channel only). Staining: (K,M) axons (acTubulin) and nuclei (DAPI). Scale bars, 100 μm (A, F’’’, G’’’), 2 mm (D,E), 250 μm (F,G,H) and 25 μm (K-N). |
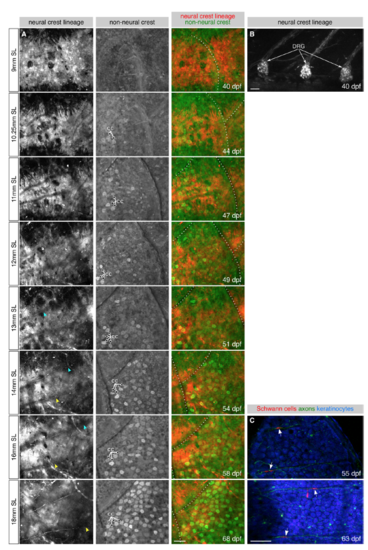
DRG axons innervate the epidermis during late juvenile stages, Related to Figure 2 (A) Repeated imaging of a single lateral skin region during scale formation. Arrowheads, individual axons extending along the scale surface. Dashed lines, scale margins. cc, club cells. (B) Lateral view of three dorsal root ganglia from the same fish as shown in panel A. (C) Isolated scales imaged at the indicated stages. Arrows, presumptive Schwann cells. Transgenes: (A) Tg(-28.5Sox10:Cre); Tg(ubb:GswitchR); (B) Tg(-28.5Sox10:Cre);Tg(ubb:GswitchR) (red channel only); (C) axons [Tg(p2rx3b:EGFP)], and keratinocytes and Schwann cells [Tg(-28.5Sox10:Cre);Tg(actb2:BswitchR)]. Scale bars, 50 μm. |
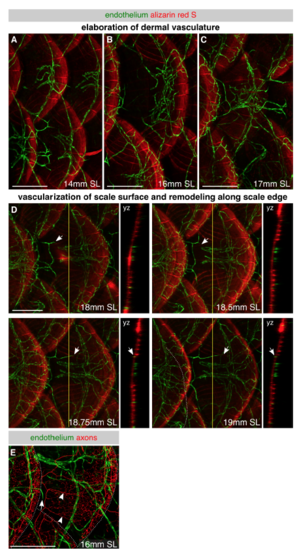
Development of skin vascularization, Related to Figure 4 (A-D) Lateral images of skin vasculature in fish expressing the pan-endothelial marker Tg(fli1a:EGFP) and stained with alizarin red S to label mineralized scales during late juvenile stages. Different individuals were imaged for each panel of A-C, whereas the same individual was repeatedly imaged in D. In panel A, note the large caliber vessels beneath each scale that connect to vessels beneath adjacent dorsal and ventral scales. In panels B and C, note the elaboration of the dermal network. In panel D, note that capillaries first extend along the radii above scales at ~18 mm SL. Arrows, vessel extending along scale surface. Yellow lines, planes of orthogonal sections. (E) Representative lateral view of the juvenile trunk in an animal expressing Tg(fli1a:EGFP) to label endothelium and Tg(p2rx3a>mCherry) to label axons. Arrow, tip of vessel growing along scale surface. Arrowheads, superficial scale nerves. Dashed lines, scale margins. Scale bars, 250 μm. |
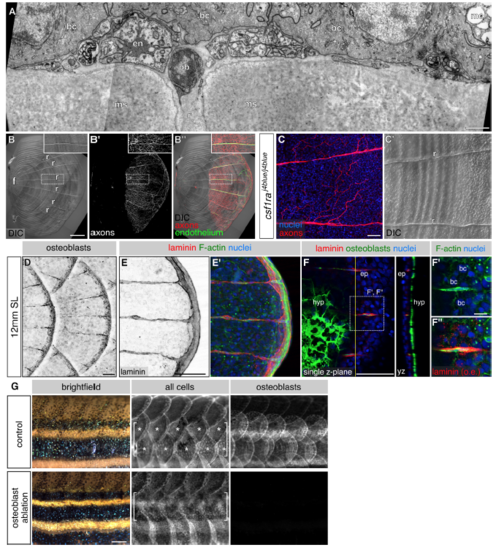
The role of osteoblasts and osteoclasts in axon patterning, ECM formation and scale regeneration, related to Figures 5 and 6 (A) Transverse TEM of scale radius. Note that the position of the nerve is variable with respect to other radial cell types (compare to Figure 3E). en, endothelium; ob, osteoblast; bc, basal cell; mc, mucus secreting cell; n, nerve; r, radius; ms, mineralized scale. (B) Lateral DIC and fluorescent images of an isolated scale. f, focus. r, radius. Dashed boxes indicate regions of magnification. Inset, a single radius. (C) Scale nerve and radial patterns in csf1ra mutants. (D) Lateral view of intact skin. (E) Posterior edge of an isolated scale immunostained as indicated. (F) Single z-plane near the posterior edge of an isolated scale immunostained as indicated. Due to the curvature of the scale, the z-plane is an oblique section through the epidermis. In panel F’’ the laminin channel has been overexposed (o.e.) to highlight the intracellular puncta within basal cells. Basal cells are distinguishable by their characteristic nuclear size and cell borders. ep, episquamal osteoblasts; hyp, hyposquamal osteoblasts; bc, basal cell. Dashed boxes indicate region of magnification. Yellow line, plane of orthogonal section. (G) Brightfield and fluorescent images of control and osteoblast-ablated adult animals 7 days after removal of two dorsolateral rows of anterior scales (brackets). Note the lack of scale regeneration in osteoblast-ablated animals compared with robust scale regeneration in control animals (asterisks). Transgenes: (B) endothelium [Tg(fli1a:EGFP)] and axons [Tg(p2rx3a>mCherry)]; (D) Tg(sp7:mCherry-nfsB); (G) all cells [Tg(actb2:BswitchR)] and osteoblasts [Tg(sp7:mCherry-nfsB)]. Staining: (C) axons (acTubulin) and nuclei (DAPI); (E) laminin (anti-laminin), F-actin (phalloidin) and nuclei (DAPI); (F) laminin (anti-laminin), osteoblasts (zns-5), F-actin (phalloidin) and nuclei (DAPI). Scale bars, 1 μm (A), 250 μm (B), 50 μm (C-F), 10 μm (F’) and 500 μm (G). |
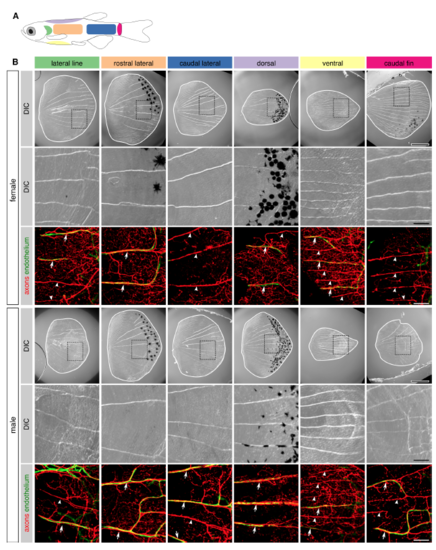
Nerves and capillaries extend along radii of scales isolated from diverse body locations, Related to Figure 5 (A) Schematic indicating the different regions of the trunk from which scales were isolated in panel B. (B) DIC and fluorescent images of scales isolated from various regions of the trunk of adult female and male animals (25-27 mm SL). White lines and dashed boxes in top panels indicate scale margins and areas of magnification for lower panels, respectively. Arrows, superficial nerves associated with vasculature. Note several examples of radii that are occupied by nerves but not vasculature (arrowheads). Transgenes: (B) endothelium [Tg(fli1a:EGFP)] and axons [Tg(p2rx3a>mCherry)]. Scale bars, 500 μm (top panels) and 100 μm (lower panels). |

Eda and Fgfr1a are required for cutaneous neurovascular polarization and maturation, related to Figure 7 (A-C) Orientation and density analysis of skin vasculature and innervation from projections through intact skin of animals expressing endothelial [Tg(fli1a:EGFP)] (A,B) and axonal [Tg(p2rx3a>mCherry)] markers (C). *, p<0.01, Wilcoxon rank sum test. n=8-11 skin regions of size 0.77-1.5 mm2 from n=3-5 fish analyzed per genotype. (D) Single z-plane through the epidermis of an isolated scale immunostained as indicated. Note that club cells (cc) and mucus secreting cells (mc) do not express the keratinocyte marker Tg(krt4:EGFP) and can be distinguished by their characteristic shapes and sizes. (E-I) Single z-planes through the epidermis of intact fish of the indicated genotypes. Note the lack of club cells in the “naked” (non-squamated) skin regions. Tg(krt4:EGFP) is highly expressed in breeding tubercles (bt), male-specific keratin-rich structures visible in panel H. cc, club cells; mc, mucus secreting cells. (J) Quantification of club cell density based on the pattern of Tg(krt4:EGFP) expression in naked and squamated skin of fish of the indicated genotypes. *, p<0.01, Wilcoxon rank sum test. n=6-12 skin regions of size 0.1-1.2 mm2 from n=4-6 fish analyzed per condition. Transgenes: (D-I) keratinocytes [Tg(krt4:EGFP)]. Staining: (D) club cells (CS-56) and nuclei (DAPI). Scale bars, 25 μm. |
Reprinted from Developmental Cell, 46(3), Rasmussen, J.P., Vo, N.T., Sagasti, A., Fish Scales Dictate the Pattern of Adult Skin Innervation and Vascularization, 344-359.e4, Copyright (2018) with permission from Elsevier. Full text @ Dev. Cell