
- Title
-
Neutrophils use superoxide to control bacterial infection at a distance
- Authors
- Phan, Q.T., Sipka, T., Gonzalez, C., Levraud, J.P., Lutfalla, G., Nguyen-Chi, M.
- Source
- Full text @ PLoS Pathog.
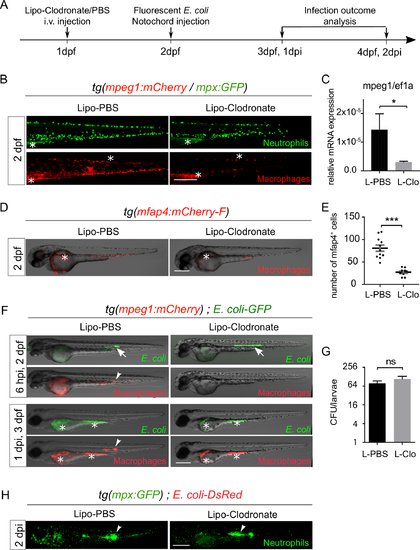
Macrophages are not involved in the clearance of bacteria injected within the notochord. (A) Experimental scheme. One dpf tg(mpeg1:mCherry-F/mpx:GFP) or tg(mfap4:mCherry-F) or tg(mpeg1:mCherry-F) embryos were i.v. injected with Lipo-Clodronate (L-clo) or Lipo-PBS (L-PBS). Correctly depleted larvae were selected based on the loss of red fluorescent macrophages, and GFP or DsRed expressing E. coli were injected within their notochord at 2 dpf. The infection outcome was analyzed at 1 and 2 dpi using fluorescence microscopy. (B) Lipo-Clodronate efficiently depletes macrophages without affecting neutrophil population. Experiments were performed as described in (A) on tg(mpeg1:mCherry-F/mpx:GFP). GFP (neutrophils) and mCherry (macrophages) were analysed by fluorescence microscopy at 2 dpf. (C) qRT-PCR measurement of mpeg1 mRNA relative to ef1a in Lipo-PBS and Lipo-clodronate conditions in whole larvae at 3 dpf (pool of 10 larvae, mean values ± Standard Error of the Mean (SEM), three experiments, Mann Whitney test, one tailed, *P<0.05). (D) Tg(mfap4:mCherry-F) were treated with Lipo-Clodronate or Lipo-PBS as described in (A). mCherry (macrophages) was analysed by fluorescence microscopy at 2 dpf. Representative fluorescence overlaid with brightfield images show macrophage depletion in Lipo-Clodronate treated larvae. (E) Macrophage counts (mfap4+ cells) at 2 dpf in indicated conditions (horizontal lines indicate the mean ± SEM, Student test, one-tailed, ***p<0.001). (F) E. coli-GFP infections in the notochord of tg(mpeg1:mCherry-F) embryos are cleared in macrophage-depleted embryos. GFP (E. coli) and mCherry (macrophages) were imaged repeatedly in individual larvae using fluorescence microscopy at 6 hpi and 1 dpi. In both Lipo-PBS and Lipo-clodronate conditions, E. coli-GFP are present in the notochord at 6 hpi (white arrows) but are cleared at 1 dpi (NL-PBS = 5 and NL-clo = 9). Arrowhead shows the recruitment of macrophage in Lipo-PBS injected larvae. Asterisks show the auto-fluorescence of the yolk. (G) CFU counts at 1 dpi in notochord infected of Lipo-PBS and Lipo-Clodronate treated larvae (mean number of CFU per larva ± SEM, NL-PBS = 9 and NL-clo = 5, Mann Whitney test, two tailed, p>0.05, ns = not significant). (H) E. coli infections in the notochord of tg(mpx:GFP) embryos after macrophage depletion with Lipo-Clodronate. GFP (Neutrophils) was imaged in larvae using fluorescence microscopy at 2 dpi (NL-PBS = 25 and NL-clo = 24). Scale bars: 400 μm. |
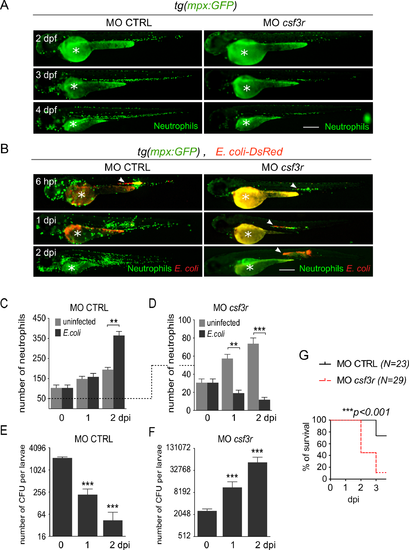
Neutrophils are essential for bacterial clearance. Tg(mpx:GFP) embryos were injected at the one cell stage with either csf3r morpholino (MO csf3r) to induce neutrophil depletion or a control morpholino (MO CTRL). (A) Steady-state neutrophil populations were imaged repeatedly in individual morphants using GFP fluorescence in both MO csf3r and control conditions between 2 and 4 dpf. (B) Fluorescent E. coli-DsRed were injected in the notochord of csf3r and CTRL morphants. GFP (Neutrophils) and DsRed (E. coli) fluorescence were imaged at indicated time points. E. coli-DsRed (red) disappeared from 1 dpi in control embryos (left panels), while it increased in csf3r morphants at 1 and 2 dpi (white arrowheads) with a concomitant decrease in neutrophil number (green). Scale bars: 400 μm. (C, D) Quantification of total neutrophils in CTRL (C) and csf3r (D) morphants at the indicated time points following PBS (light grey columns) or E. coli (dark grey columns) injections (mean number of cell per larva ± SEM, Mann-Whitney test, two-tailed, **p<0.005, ***p<0.001, Nlarvae = 7–16 per condition, from two independent experiments). (E, F) E. coli log counts (CFU) in CTRL (E) and csf3r morphants (F) (mean number of CFU per larva ± SEM, Mann-Whitney test, two-tailed, ***p<0.001, Nlarvae = 3–4 per condition). (G) Survival curve of MO csf3r and MO CTRL larvae infected with E. coli from 0 to 3 dpi (Nlarvae is indicated in the figure, log rank test, p<0.001, from two independent experiments). |

Neutrophil ablation using Nitroreductase/Metronidazole system leads to bacterial growth during notochord infection. (A-B-C-D) Tg(mpx:Gal4/UAS:nfsB-mCherry/mpeg1:GFPcaax) embryos were treated with DMSO or MTZ at 40 hpf and imaged at 0, 1 and 2 days post-treatment (dpT) with fluorescence microscopy. (A) Quantification of total neutrophils in DMSO and MTZ treated larvae at 0 and 1 and 2 dpT (mean number of neutrophils per larva ± SEM, Student’s test, one-tailed, *p<0.05, ***p<0.001, NDMSO = 21, NMTZ = 13–23). (B) Quantification of total macrophages in DMSO and MTZ treated larvae at 1 dpT (horizontal lines indicate mean values ± SEM, two independent experiments, Student’s test, two-tailed, ns: not significant, p>0.05, NDMSO = 15, NMTZ = 19). (C-D) Transgenic embryos were infected with E. coli-crimson in the notochord one day after MTZ treatment and imaged (C) before infection and (D) at 4 hpi with Spinning Disk confocal microscopy. (C) Representative overlay of maximum projections of montage acquisitions (mCherry and GFPcaax) with transmitted light images show neutrophil and macrophage distribution in DMSO and MTZ treated larvae before infection and (D) macrophage recruitment (arrowheads) at 4 hpi to the notochord (n). White boxes are zoomed areas. Similar results were obtained with 5 and 10 mM MTZ. (E) Tg(mpx:Gal4/UAS:nfsB-mCherry) embryos were treated with MTZ at 40 hpf and, at 3 dpf, larvae were injected either with PBS or E. coli-GFP in the notochord. The outcome of the infection was analysed by fluorescent microscopy. Larva images are representative overlays of fluorescence and transmitted light images at 2 dpi. In the absence of MTZ, neutrophils are massively recruited to the notochord and E. coli is cleared (white arrowheads). In MTZ-treated larvae, E. coli (green arrowheads) grow heavily. Scale bars: 400 μm. (F) Bacterial load quantification by Fluorescent Pixel Count (FPC) in MTZ treated Tg(mpx:Gal4/UAS:nfsB-mCherry) (nfsB+ MTZ) at 0, 1 and 2 dpi showing significant differences in the bacterial load with control groups (Tg(mpx:Gal4/UAS:nfsB-mCherry) treated with DMSO referred as nfsB+ DMSO and non transgenic siblings treated with MTZ referred as nfsB- MTZ) (horizontal bars indicate the median, Kruskall-Wallis test with Dunn’s post-test, **p<0.01, ***p<0.001, NnfsB+ DMSO = 9–12, NnfsB- MTZ = 8–9, NnfsB+ MTZ = 7–12). |

MPO is not required for bacterial clearance in the notochord. (A) Tg(mpx:GFP)/mpx+/- (A1, A2) and tg(mpx:GFP)/mpx-/- (A3, A4) embryos were infected with E. coli in the notochord. Sudan Black staining and immuno-detection of neutrophils (anti-GFP) were performed in whole embryos at 1 dpi. The top right panel shows the regions imaged by confocal microscopy in the larvae in A1 and A3 (green box) and in A2 and A4 (red box). Representative transmitted light images, overlaid with a maximal projection of confocal fluorescence images show the presence of black granules in the neutrophils (white arrows) of tg(mpx:GFP)/mpx+/- embryos. MPX granules are absent in neutrophils (white arrowheads) of tg(mpx:GFP)/mpx-/- embryos. Scale bars: 10 μm and white dotted lines outline neutrophils. (B) Tg(mpx:GFP)/mpx-/- embryos were infected with E. coli-DsRed in the notochord. Neutrophils (GFP) and E. coli (DsRed) were imaged repeatedly in individual larvae using fluorescent microscopy at 6 hpi and 1 dpi. While E. coli locates in the notochord at 6 hpi (arrowheads), it disappears at 1 dpi. (Nmpx+/- = 9, Nmpx-/- = 8 embryos per condition, from two independent experiments). Scale bar: 400 μm. |

Superoxide is produced in neutrophils of infected larvae. (A-D) Two dpf tg(mpx:GFP) embryos were either injected with PBS (A) or infected with E. coli-GFP in the notochord (B, C, D). At 6 hpi, superoxide was detected in living animals using Dihydroethidium (DHE, red) and neutrophils were visualized using GFP fluorescence (green). (A) Representative transmitted light images, overlaid with a maximal projection of confocal fluorescence images show that superoxide is lightly produced in the recruited neutrophil at the injection site. (B) White boxes in the larva image show the regions imaged by high resolution confocal microscopy and green arrowhead shows the injection site. (C) Representative time-lapse maximum projections starting 6 hpi during 16 min, show superoxide presence in phagosomes (white arrows) bearing bacteria (yellow stars: E. coli-GFP, Green) in recruited neutrophils at the injection site. Time is in minutes. (D) Representative transmitted light images, overlaid with a maximum projection of confocal fluorescence images show superoxide in neutrophils (white arrowheads) over the E. coli (yellow stars) infected notochord. Scale bars: 15 μm, dotted lines encase the notochord (NC). (E) Tg(mpx:GFP) larvae were infected with E. coli-GFP in the notochord and treated either with DMSO or NAC. Trunk images are representative maximum projections of single fluorescence (DHE and GFP) and merge channels using confocal microscopy. Scale bar = 50 μm. (F-H) Quantification of recruited DHE+ cells (F), recruited DHE+ MPX+ cells (G), and recruited neutrophils (H) in indicated conditions (mean number of cell/larva ± SEM, ***p<0.001, ns: non significant, NDMSO = 16–17 and NNAC = 13–14, from three independent experiments). The diagrams represent the regions selected for the counting. |
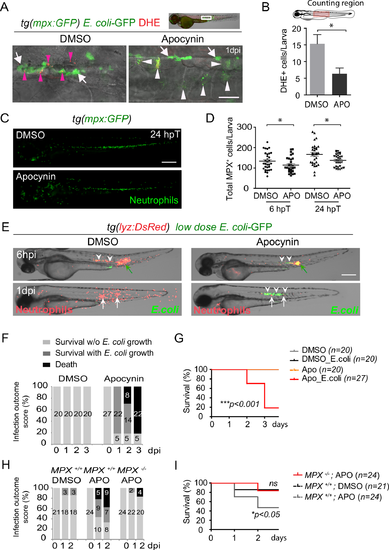
NADPH oxidase inhibitor Apocynin increases susceptibility to notochord infection. (A-B) E. coli-GFP were injected in the notochord of 2 dpf tg(mpx:GFP) embryos in DMSO or Apocynin treatment conditions. (A) At 1 dpi, superoxide production was visualised using DHE (red), neutrophils and E. coli were detected using GFP. Notochord images are representative maximum projection of fluorescence confocal images overlaid with transmitted light images. Pink arrowheads show DHE+ neutrophils, white arrows show DHE- neutrophils and white arrowheads: E. coli, scale bars: 30 μm. (B) Quantification of DHE-positive cells in DMSO and Apocynin treated larvae (mean ±SEM, Nlarvae = 5 per condition, Mann-Whitney test, one-tailed, * p<0.05). (C, D) Tg(mpx:GFP) embryos were treated with Apocynin (APO) or DMSO at 2 dpf. Neutrophils (GFP) were imaged using fluorescent microscopy at 6 hours post-treatment (hpT) and 24 hpT. (C) Representative fluorescent images of Apocynin or DMSO treated larvae at 24 hpT. Scale bar: 400 μm. (D) Corresponding counts of total neutrophil population in indicated conditions (mean ± SEM, NDMSO = 31 and NAPO = 29, Mann-Whitney test, two-tailed, * p<0.05, representative of 2 independent experiments). (E, F, G) Two dpf tg(lyz:DsRed) embryos were infected in the notochord with E.coli-GFP and treated with Apocynin. (E) Neutrophils (DsRed) and E. coli (GFP) were imaged repeatedly in individual larvae using fluorescent microscopy at 6 hpi and 1 dpi. Bacteria (white arrowheads) were present at 6 hpi in both DMSO- and Apocynin-treated embryos. At 1 dpi, bacteria disappeared in DMSO-treated embryos (arrows) while their number increased in Apocynin-treated embryos (white arrowheads). (F) Infection outcome of E. coli infected embryos after in DMSO or Apocynin treatments were scored from 0 to 3 dpi (the number of larvae is indicated in the columns). (G) Survival curves of larvae uninfected and infected with E. coli from 0 to 3 dpi in DMSO or Apocynin treatments. (Nlarvae is indicated in the figure, log rank test, p<0.001, from two independent experiments). (H) Two dpf mpx+/+ or mpx-/- embryos were infected in the notochord with E. coli-GFP and treated either with DMSO or Apocynin (APO). Infection outcome of E. coli infected embryos were scored from 0 to 2 dpi (the absolute number of larvae is indicated in the columns). (I) Survival curves of mpx+/+ or mpx-/- larvae infected with E. coli from 0 to 2 dpi in DMSO or Apocynin treatments (Nlarvae is indicated in the figure, log rank test, p<0.01, from two independent experiments). |

p47phox is required for bacterial clearance at a distance and host survival following notochord infection. (A-C) Tg(mpx:GFP) embryos were injected at the one cell stage with either p47phox morpholino (MO p47phox) or a control morpholino (MO CTRL). Steady-state neutrophil populations were imaged in 2 dpf morphants using fluorescence microscopy. Scale bar: 400 μm. (B) Neutrophil counts in whole larvae (mean number of neutrophils per larva ± SEM, NMO CTRL = 47 and NMO P47 = 47, Mann-Whitney test, two-tailed, **p<0.005, from three independent experiments). (C) At 2 dpf, p47phox and CTRL morphants were infected with E. coli-GFP in the notochord and imaged using fluorescence microscopy at 4 hpi and 1 dpi. Graph represents mean number of recruited neutrophils per larva ± SEM in the notochord region (NMO CTRL = 10–14 and NMO P47 = 12–16, Mann-Whitney test, one-tailed, p>0.05 ns: non significant, from two independent experiments). (D) p47phox and CTRL morphants were infected with E. coli-GFP in the notochord at 2 dpf and GFP fluorescence (bacteria) was imaged repeatedly in individual larva, fluorescence was overlaid with transmitted light images at 1 hpi and 1 dpi. Black arrowheads indicate the infection site, scale bar: 400 μm (NMO CTRL = 19/21 and NMO p47 = 16/21). (E) The CFU counts at 1 dpi in notochord infected of p47phox and CTRL morphants (mean number of CFU per larva ± SEM, NMO CTRL = 13 and NMO P47 = 8, Mann-Whitney test, one-tailed, **p<0.01, from three independent experiments). (F) Survival curves of p47phox and CTRL morphants that have been injected with PBS or E. coli in the notochord from 0 to 3 dpi (N is indicated in the figure, log rank test, ***p<0.001, from 4 independent experiments). |

Comparison of E. coli K12 strain with enteric adherent invasive E. coli strains in notochord infection model. (A) Diagram showing the injection of Crimson expressing E. coli in the notochord (arrow: injection site) in triple transgenic larvae tg(RCN3:gal4/UAS:DsRed/mpx:GFP) at 2 days post-fertilization larva (dpf). (B) Larvae were analyzed by confocal microscopy at 5 hours post-injection (hpi) of either PBS or Crimson-E. coli. Notochord images are representative 3D projections of overlaid fluorescence channels: DsRed (blue), GFP (green) and Crimson (magenta). The right panel is a projection of cross-section view of the notochord in the region indicated by the dotted line. Dashed circle outlines the notochord. Scale bar: 30 μm. (C) Electron microscopy of the notochord region in infected larvae at 4 hpi. b: bacteria, nc: notochord, col: collagen sheath. Scale bar = 1μm. (D) GFP expressing Escherichia coli strains (K12, AIEC LF82, LF82-ΔlpfA and JM83-ΔmsbB) were injected in the notochord of tg(mpx:GFP) embryos at 2 dpf. GFP (E. coli and neutrophils) was analysed by fluorescence microscopy at 1 dpi. In AIEC LF82, LF82-ΔlpfA and JM83-ΔmsbB infections, bacteria were cleared and neutrophil recruitment to the notochord (N) was induced similarly to K12 infections (arrowheads). Scale bar: 400 μm. (E) Survival curves of zebrafish larvae that have been infected in their notochord with indicated Escherichia coli strains from 0 to 2 dpi (Log rank test, ns = not significant p>0.05, N is indicated on in the figure). |
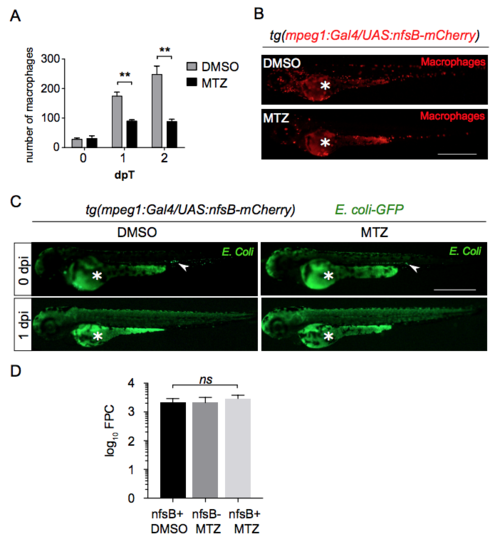
Macrophages ablation using Nitroreductase/Metronidazole system does not affect bacterial growth during notochord infection. (A-B) Tg(mpeg1:Gal4/UAS:nfsB-mCherry) larvae were treated either with DMSO or Metronidazole (MTZ) added in fish water at 35 hpf. Treated larvae were imaged at 0, 1 and 2 days post-treatment (dpT) using fluorescence microscopy. (A) Quantification of total macrophages in DMSO and MTZ treated larvae at 0 and 1 and 2 dpT (Mean number of cell/larva ± SEM, NDMSO = 5 and NMTZ = 5, three independent experiments, Mann-Whitney test, one-tailed, **p<0.005). (B) Representative fluorescent images (DsRed) of DMSO and MTZ treated larvae at 1 dpT. Asterisk: auto-fluorescence of the yolk. Scale bar: 600 μm. (C) At 1 dpT larvae were infected with E. Coli-GFP in the notochord. Representative fluorescent images (GFP) showing infection outcome at 0 and 1 dpi for two indicated conditions. Asterisk: auto-fluorescence of the yolk, white arrowhead: E. Coli-GFP injection site. Scale bar: 600 μm. (D) Bacterial load quantification by Fluorescent Pixel Count (FPC) in MTZ treated Tg(mpeg1:Gal4/UAS:nfsB-mCherry) (nfsB+ MTZ) at 1 dpi showing no significant differences in the bacterial load with control groups (Tg(mpeg1:Gal4/UAS:nfsB-mCherry) treated with DMSO referred as nfsB+ DMSO and non transgenic siblings treated with MTZ referred as nfsB- MTZ) (mean values ± SEM, Kruskall-Wallis test with Dunn’s post-test, NnfsB+ DMSO = 13, NnfsB- MTZ = 7, NnfsB+ MTZ = 13). |
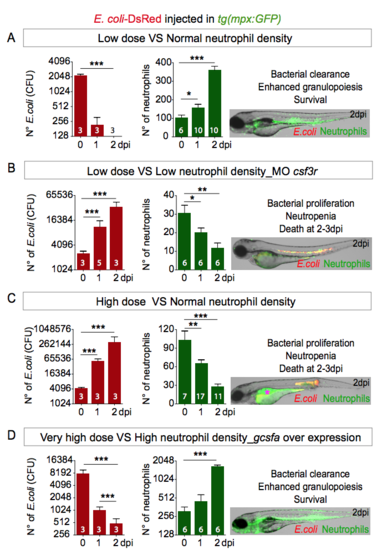
Embryos need correct neutrophil density to fight notochord infection. Two dpf tg(mpx:GFP) embryos were infected in the notochord with low dose (< 3000 CFUs) (A, B), high dose (> 4000 CFUs) (C) or very high dose (>7000 CFUs) (D). (B) To decrease neutrophil density, tg(mpx:GFP) embryos were injected at the one cell stage with the csf3r morpholino and then infected in the notochord at 2 dpf with a low dose of red fluorescent E. coli-DsRed. (D) To increase neutrophil density, tg(mpx:GFP) embryos were injected at the one cell stage with the gcsfa over-expressing plasmid and then infected in the notochord at 2 dpf with a very high dose of red fluorescent E. coli-DsRed. Charts show the quantification of CFU (red-bar charts) and of the total neutrophil number (green-bar charts) at 0, 1 and 2 dpi (Mann-Whitney test, two-tailed, Nlarvae is indicated on the columns, *p<0.05, ** p<0.01 and ***p<0.001). Larvae images are representative overlays of fluorescence (green: neutrophils and red: E. coli) and transmitted light images at 2 dpi (asterisk: auto-fluorescence of the yolk). |

gcsfa, gcsfb and lyz expressions upon injection of gcsfa and gcsfb plasmids in zebrafish embryos and effects of gcsfb overexpression during notochord infection. qRT-PCR of gcsfa (A), gcsfb (B) and lyz (C) mRNAs relative to ef1a in wild type larvae or in larvae expressing a gcsfa- or gcsfb- transgenes. Embryos were either uninjected (CTRL) or injected with a gcsfa- or gcsfb-overexpressing plasmid at one cell-stage. They were subsequently either uninfected or infected with E. coli in the notochord at 2 dpf. RNA was extracted from whole larvae at 1–2 dpi (6 larvae per pool, mean ± SEM, N = 2–4). (D-F) Two dpf tg(mpx:GFP) embryos overexpressing gcsfb were either uninjected or infected in the notochord with a high dose of fluorescent E. coli-DsRed (>4000 CFU). (D) Larvae images are representative overlays of fluorescence (E. coli) and transmitted light images at 2 hpi and 2 dpi, showing the disappearance of bacteria at 2 dpi. Arrowhead shows the injection site. Scale bars = 400μm (Nlarvae = 6). (E-F) Quantification of neutrophil population at 2, 3 and 4 dpf in uninfected larvae (E) and at 0, 1 and 2 dpi in E. coli infected larvae (F) (Mann-Whitney test, two-tailed, Nlarvae is indicated on the columns, ***p<0.001). |

Notochord infection induces neutrophils death. Tg(lyz:DsRed) larvae were either injected with PBS (A) or infected with low dose (LD) (B) or high dose (HD) (C) of E. coli in the notochord. Neutrophils were detected using DsRed (red) and dead cells using Sytox Green (green) at 24 hpi and trunk regions were imaged using Spinning Disk Confocal microscopy. Representative maximal projections of confocal montages show increased cell death, including dead neutrophils around the notochord in HD infection, comparing to LD and PBS injection. White stars show non-specific staining in the yolk extension and neurones of the spinal cord. Arrowheads show Sytox Green injection sites. White boxes in the left panels show the zoomed areas (right panels). Scale bars: 50 μm for the left panels and 25 μm for the right panels. (D) Number of Sytox Green positive cells and (E) Sytox Green positive neutrophils around the notochord in indicated conditions (mean number of cell/larva ± SEM, NPBS = 9, NLD = 9 and NHD = 8, from two independent experiments, Kruskal Wallis test with Dunn’s post-test, *p<0.05, ***p<0.001). |

High dose infection in the notochord leads to increased macrophage population. (A) Two dpf tg(mpeg1:mCherry-F) larvae were injected in the notochord either with low dose (LD) or high dose (HD) E. coli-GFP. Trunk regions were imaged using fluorescence microscopy at 1 dpi. Scale bar: 200 μM. Representative fluorescence (mCherry and GFP) overlaid with bright field images shows macrophage accumulation around the notochord in both LD and HD infections. Bacteria proliferate in HD infection. (B) Two dpf tg(mfap4:mCherry-F) larvae were injected in the notochord either with PBS or high dose E. coli-GFP. Counts of macrophages in the trunk and tail region by Leukocyte Unite quantification (LU) in indicated conditions (mean values ± SEM, Mann Whitney’s test, two-tailed, NPBS = 12–14 and NHD = 6–9, *p<0.05). Larva diagram shows the region of counting. |

Recruited neutrophils do not produce detectable Nitric Oxide. (A) Nitric oxide is produced by neutrophils in the AGM following Salmonella Typhimurium infection. Two dpf tg(lyz:DsRed) embryos were infected in the hindbrain or in the notochord with Salmonella Typhimurium. At 2 dpi Nitric oxide was detected with DAF-FM-DA (green) using confocal microscopy. Representative overlay of maximum projections of multi scan acquisitions (DsRed and DAF-FM-DA) with transmitted light images shows that Nitric oxide is produced by neutrophils in the AGM (A left panel) and in the notochord (A right panel), but not in the recruited neutrophils (A right panel) (Nhindbrain = 3 And Nnotochord = 3). (B) Two dpf tg(lyz:DsRed) embryos were infected with E. coli-GFP in the notochord. (B1, B2) Representative overlay of maximum projections of multi-scan acquisitions (DsRed and DAF-FM-DA) with transmitted light images shows that Nitric oxide (green) is produced constitutively in the notochord (white arrowheads) but not in recruited neutrophils at 6 hpi (pink arrowheads). (B3-B6) Trunk images are representative DAF-FM-DA fluorescence (B3-B4) and DsRed fluorescence images (B5-B6) from PBS- or E. coli-injected embryos at 1 dpi. NPBS = 2 and NE.coli = 10, AGM: Aorta-gonad-mesonephros, NC: notochord, scale bars: 30 μm. (C) Two dpf tg(lyz:DsRed) embryos were infected in the notochord with E. coli-GFP and then immediately treated with either L-NAME or water (CTRL). Bacteria in the whole larvae were imaged using fluorescent microscopy at 0 and 1 dpi and bacterial burden were quantified by Fluorescent Pixel Count (FPC) (horizontal lines indicate the median values, NCTRL = 9–11 and NL-NAME = 10–11, representative of 4 independent experiments, Kruskal-Wallis’ test with Dunn’s post-test, ns: not significant, p>0.05). |

NADPH oxidase inhibitor Apocynin does not affect muscle infection outcome. (A-B-C) E. coli-DsRed were injected in the muscle of 2 dpf tg(mpx:GFP) embryos in DMSO or Apocynin treatment conditions. Bacteria (red) in the trunk region were imaged using fluorescent microscopy at 0 dpi and 1 dpi. (A) Representative bright field images overlaid with fluorescent channel of DMSO and Apocynin treated larvae. (B) Quantification of bacterial burden by Fluorescent Pixel Count (FPC) in indicated conditions (horizontal lines indicate the median values, NDMSO = 18–19 and NAPO = 16–17, Kruskal-Wallis’ test with Dunn’s post-test, *** p<0.001). Larva diagram shows the region of counting. (C) Survival curves of DMSO and Apocynin treated larvae infected with E. coli in the muscle from 0 to 3 dpi or injected with PBS (Nlarvae is indicated in the figure, log rank test, p>0.05, ns: not significant). |

NADPH oxidase inhibitor VAS2870 increases the susceptibility of larvae to notochord infection. (A) Experimental scheme. VAS2870 or DMSO was injected in the yolk of tg(lyz:DsRed) or tg(mpx:GFP) embryos at 2 dpf. One hour later, fluorescent E. coli bacteria were injected in the notochord and the injected embryos were scored from 1 dpi. (B) Representative fluorescent images of neutrophils in the VAS2870 or DMSO treated tg(mpx:GFP) embryos at 1 day post treatment (dpT) without bacterial injections. Scale bar: 400 μm. (C) Counts of total neutrophil population in indicated conditions at 6 hours (hpT) and 1 dpT (mean ± SEM, NDMSO = 29–30 and NVAS2870 = 25–29, Mann-Whitney test, two-tailed, p>0.05, ns = not significant). (D) Trunk images are representative overlays of DsRed (neutrophils), GFP (E. coli) and transmitted light images at 1 dpi in PBS- or E. coli- injected larvae in DMSO or VAS2870 treatment conditions. Scale bars: 100 μm. White arrowheads: E. coli in the notochord. (E) Survival curves of larvae injected with either PBS or E. coli from 0 to 3 dpi in DMSO or VAS2870 treatments (Nlarvae is indicated in the figure, log rank test, ***p<0.001, from three independent experiments). (F) Larva phenotypes and bacterial outcome were scored from 0 to 3 dpi. (w/o: without bacterial growth, the number of larvae (N) is indicated each the column, from three independent experiments). |

p47phox morpholino deceases superoxide production in activated neutrophils. Tg(mpx:GFP) embryos were injected at the one cell stage with either p47phox morpholino (MO p47phox) or a control morpholino (MO CTRL). Morphants were infected in the muscle with GFP- E. coli and superoxide was detected with DHE at 3 hpi. (A) Larvae images are representative fluorescence images of DHE at 3 hpi. Scale bar: 100 μm. White boxes indicate the position of the confocal images in (B). (B) Representative overlay of GFP fluorescence (neutrophils+E. coli) with DHE fluorescence (maximal projections of confocal images) show superoxide in neutrophils in control morphants but not in p47phox morphants. Scale bars: 50 μm. (C-D) Dot plots are quantification of recruited DHE+ cells (C), recruited neutrophils (D), and recruited DHE+ MPX+ cells (E) in CTRL and p47phox morphants (mean number of cell/larva ± SEM, NMO CTRL = 13, NMO P47 = 13, Mann-Whitney test, two-tailed, ***p<0.001, ns: p>0.05 non significant). Diagrams show the counting region. |