
- Title
-
Polarity and morphogenesis of the eye epithelium requires the adhesion junction associated adaptor protein Traf4
- Authors
- Hehr, C.L., Halabi, R., McFarlane, S.
- Source
- Full text @ Cell Adh. Migr.

traf4a is expressed in the developing eye vesicle. A-C,E: Wholemount in situ hybridization viewed laterally (A,B) and in anterior (C) and posterior (E) transverse sections with antisense riboprobe for traf4a mRNA. D: Immunolabeling of transverse sections through an eye vesicle and forebrain of a 12ss embryo with an antibody against ZO-1 to identify apical surface of eye vesicle. F: traf4a mRNA is still expressed in the 18 ss eye vesicle. Orientation bar in C applies to panels C-E. a, apical; b, basal; D, dorsal; e, eye vesicle; tel, telencephalon; V, ventral. EXPRESSION / LABELING:
|
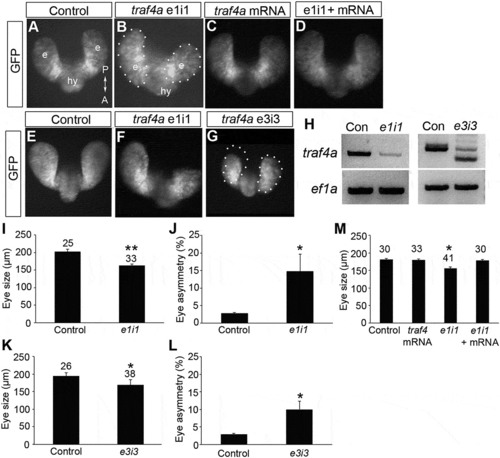
Traf4a knockdown results in small and asymmetric eye vesicles. A-G: Dorsal views of 12 ss (A-D) and 18 ss (E-G) Tg(rx3:GFP) control embryos (A,E), and embryos injected with either e1i1 MO (B,F), e3i3 MO (G), wild-type zebrafish traf4a mRNA (C), or e1i1 MO along with wild-type zebrafish traf4a mRNA (D). In G, the left eye vesicle outline is superimposed on the right eye. Morphant eye vesicles (outlined) are misshaped, and can be smaller in antero-posterior length. e, eye vesicle; hy, hypothalamus. H: RT-PCR showing knockdown or missplicing of the traf4a transcript with the e1i1 and the e3i3 antisense MOs, respectively, with ef1α as a loading control. I,K,M: Eye size (µm) as measured by the antero-posterior length of the shorter eye vesicle for 18 ss control, and e1i1 (I) and e3i3 (K) traf4a morphant embryos; 12 ss control embryos, and embryos injected with e1i1 with or without wild-type zebrafish traf4a mRNA (M). J,L: Mean percentage difference between the length of e1i1 (J) or e3i3 (L) embryos’ two eye vesicles. Error bars are standard deviation, and numbers above bars indicate number of embryos. Statistics (* p < 0.05, **, p < 0.01) represent: two-tailed, unpaired Student’s t-tests for I,K (N = 3) and J,L (N = 4); One Way ANOVA, Dunnett’s post-hoc test (M, N = 4). PHENOTYPE:
|
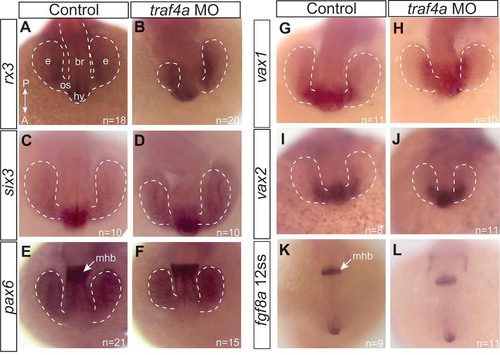
Gross patterning of the anterior neural keel is not disrupted with Traf4a knockdown. Dorsal views of 12 ss control (A,C,E,G,I,K) and traf4a morphant (B,D,F,H,J,L) embryos processed with antisense riboprobes for rx3 (A-B; N = 2), six3 (C-D; N = 2), pax6 (E-F; N = 2), vax1 (G-H; N = 1), vax2 (I-J; N = 1), and fgf8a (K-L; N = 1). Eye vesicles outlined in white dots. br, brain; e, eye vesicle; hy, hypothalamus; mhb, midbrain/hindbrain border; os, optic stalk EXPRESSION / LABELING:
|

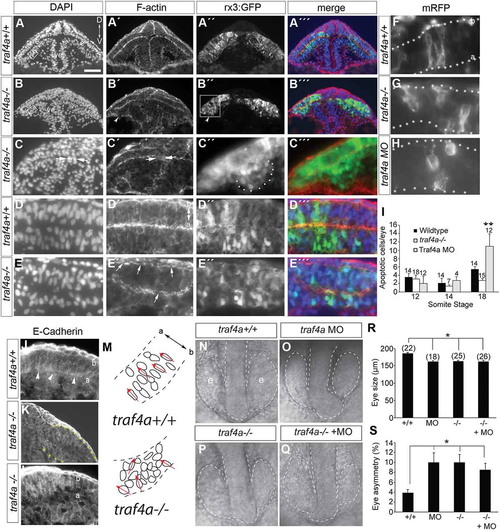
traf4a knockdown disrupts apical adherens junction protein localization. Cryostat sections of 12 ss Tg(rx3:GFP) control (A-D,I-L,Q-T) and traf4a morphant (E-H,M-P,U-X) embryos labeled with antibodies for β-Catenin (B,D,F,H), E-Cadherin (Q,U,S,W), and aPKC (T,X), and rhodamine-phalloidin to reveal F-actin (J-L,N-P). Shown is the merge with the corresponding GFP+ eye progenitors (C,G,K,O,S,W). High magnification views in D,H,L,P,S,T,W,X. Red arrows (F,G,U) point to open ventricle, and white arrow in G to a bulge off the eye vesicle. In morphants, β-Catenin shows aberrant apical accumulations (F,H, white arrows), patches where the radial orientation of F-actin label evident in control (L) is lacking (P), and breaks in β-Catenin and F-actin label basally (B,D,F,H,J,N,L,P arrowheads). E-Cadherin accumulation at the apical surface in control (Q,S arrowheads) is lost in morphant (U,W arrows). Of note, E-Cadherin is expressed at high levels in the skin epithelium (S). T,X: aPKC+ ectopic cells within the forebrain/eye vesicle ventricle (ve) in morphant (E,F,N,X asterisks) but not control (A,B,T). Orientation in A applies to all panels. Scale bar in A: 15 µm (L,P), 25 µm for D,H,S,T,W,X and 50 µm for remaining panels. PHENOTYPE:
|
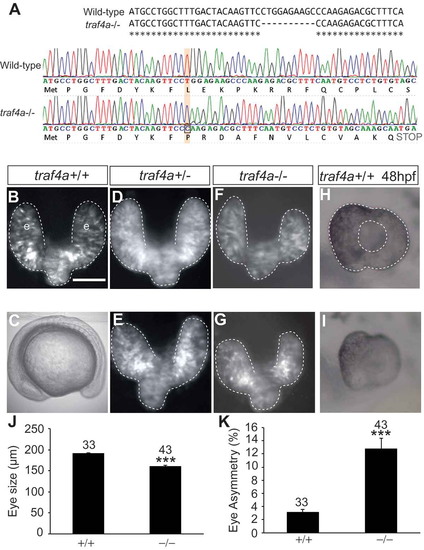
The traf4a morphant eye phenotype is phenocopied in a traf4a genetic mutant. A. The nucleotide sequence of exon1 of the traf4a gene in wild-type and traf4a-/- fish indicating the 10 bp deletion caused by CRISPR mutagenesis, and wild-type and mutant sequence chromatograms showing the premature stop codon introduced in the mutant by the resulting frameshift. B-G: Dorsal views (B,D-G) of traf4a+/+, traf4a+/- and traf4a-/- 14 ss embryos in a Tg(rx3:GFP) background, and a traf4a-/- embryo in brightfield (C). H-I: Lateral view of 48 hpf eyes. Scale bar in B is 100 µm for panels B, D-I. J-K: Quantitation of mean eye size (J) and % difference between the sizes of the two eyes (K). Number of embryos analyzed is shown. *** p < 0.001, non-parametric Mann-Whitney Rank Sums Test. PHENOTYPE:
|
Eye epithelium disrupted in traf4a CRISPR mutant. A-E: Transverse sections through the eye vesicles (e) of wild-type (A,D) and traf4a-/- 12 ss Tg(rx3:GFP) (B,C,E) embryos revealing DAPI-stained nuclei (A-E) and rhodamine-phalloidin stained F-actin (A’-E’), with merge in A’’’-E’’’. In B’ arrowhead points to a bulge off the eye vesicle (shown at higher magnification in C’’), and in C,C’ arrows point to cell cluster in ventricle (ve). Scale bar in A is 100 µm for A-B, 75 µm for C,C’ and 25 µm for C’’,C’’’,D-E,J-L. Higher magnification view (D,E) reveals disruption of organization of DAPI nuclei (E) and non continuous F-actin (E’, arrows) in mutant. F-H: mRFP expressing progenitors in the eyes of wildtype (F), traf4a-/- (G) and traf4a morphant (H) 14 ss embryos. I: Graph of the mean number of activated Caspase-3 positive cells in the whole eye of embryos at the indicated somite stages. Error bars are standard error of the mean (s.e.m.) and numbers above the bars indicate the numbers of embryos assessed (data pooled from two independent experiments). **, p < 0.01 One Way ANOVA, Bonferroni correction. J-L: E-Cadherin labeling of 14 ss wildtype (J) and traf4a-/- (K) rx3:GFP embryo (high power in L). Arrowheads show accumulation of E-Cadherin label at the apical surface in wildtype. M: Schematic of DAPI-labeled nuclei in boxed areas in A and B, with the orientation of selected nuclei indicated by red arrows. N-Q: Dorsal brightfield images of traf4a+/+ (N), e1i1 MO+ traf4a+/+ (O), traf4a-/- (P), and e1i1 MO+ traf4a-/- (Q) embryos with the eye vesicle and brain outlined. R-S: Quantitation of size of smallest 12 ss eye (R) and the % difference between the sizes of the two eyes (S). Number of embryos analyzed is shown. Error bars are standard deviation. *p < 0.05, Kruskal Wallis One Way ANOVA, followed by Dunn’s method for multiple comparisons. a, apical; b, basal. PHENOTYPE:
|
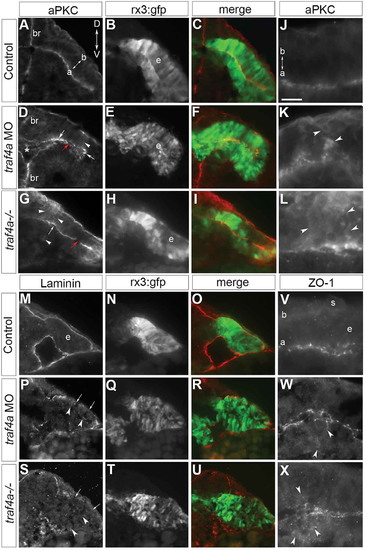
Traf4a loss disrupts apical-basal polarity of the eye epithelium. Transverse sections through the anterior forebrain (br) and eye vesicles (e) of control (A-C,J,M-O,V), traf4a morphant (D-F,K,P-R,W), and traf4a-/- (G-I,L,S-U,X) 12-14ss Tg(rx3:GFP) embryos. A-L: aPKC (A,D,G,J-L) immunolabeling, and merge (C,F,I) with GFP (B,E,H). Unevenly distributed apical (D,G arrows), and patches of non-apically localized (D,G,K,L; arrowheads), aPKC immunolabel are evident with Traf4a loss. M-U: Laminin immunolabeling (M,P,S) is basally localized in control, but patchy (arrows) and occasionally ectopically expressed (arrowheads) in morphants and mutants. V-X: ZO-1 immunolabeling is predominantly at the apical surface of the eye epithelium, but is also ectopic to the apical surface (W,X; arrowheads) with Traf4a loss. Orientation in A applies to all panels. a, apical; b, basal; s, skin. Scale bar in J is 50 µm (A-I), 75 µm (M-U), and 20 µm (J-L, V-X). EXPRESSION / LABELING:
PHENOTYPE:
|
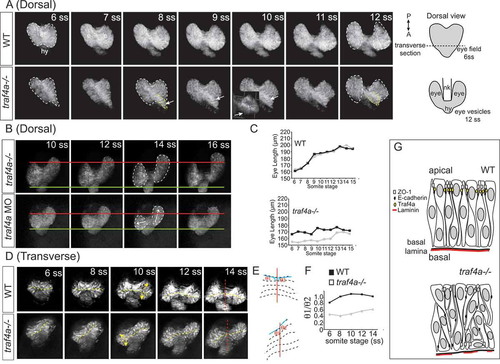
Eye vesicle evagination and elongation abnormal with Traf4a loss. Sequential confocal maximal projection of optical sections from Tg(rx3:GFP) control, e1i1 MO injected and traf4a-/- eye vesicles over the period of eye evagination and elongation (6–18 ss). Time-lapse sequences were obtained for the dorsal view from n = 6 control, n = 3 morphant and n = 5 traf4a-/- embryos, and for the transverse view from n = 8 control, n = 9 morphant and n = 3 traf4a-/- embryos. A-B: Dorsal view, from the 6–12 ss (A) and from the 10–16 ss (B). Eye vesicles outlined in white, and a bulge in the eye field (ef) outlined in yellow, and shown as a 3-D reconstruction (inset). Asymmetric evagination of the eye vesicles indicated by arrows. In B, the green and red lines mark the anterior and posterior extent of the left eye vesicles at the 10 ss. C: Length of the two eye vesicles over time for the two embryos shown in A. D-F: Transverse view (D), from the 6–14 ss. Dotted yellow lines mark the ventricles, and the red line the midline of the neural keel. These lines are represented anew in E, and the ratios of the angles of the ventricle to the midline for the two eye vesicles over time are shown in F. G: Model for Traf4a function in the eye epithelium. Traf4a is an adaptor protein found at the plasma membrane that associates with both adherens (E-cadherin) and tight (ZO-1) junction proteins in other systems. Based on the literature, we propose that Traf4a is co-localized with these proteins at the apical surface of the nascent zebrafish eye epithelium. In the absence of Traf4a, ZO-1 is present in a patchy fashion on the apical surface and ectopic to the apical surface, while E-Cadherin does not accumulate apically. Further, expression of the basally located protein Laminin is disrupted. Consequently a disorganized epithelium is formed, whose cells can lose their apical attachment and radially-oriented nuclei, which is associated with a failure of eye vesicles to evaginate and elongate PHENOTYPE:
|