
- Title
-
Bsx controls pineal complex development
- Authors
- Schredelseker, T., Driever, W.
- Source
- Full text @ Development
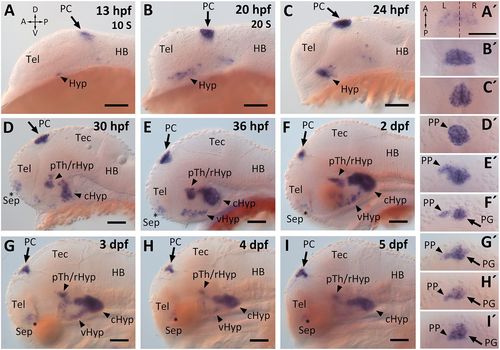
bsx expression during zebrafish embryonic development. (A-I′) bsx expression visualized by WISH. (A-I) Lateral views of head region of zebrafish embryos, and (A′-I′) dorsal views of the PC of the same embryos. Developmental stages (S, somite stage) and orientations (A, anterior; D, dorsal; L, left; P, posterior; R, right; V, ventral; dashed line indicates the midline) are indicated. HB, hindbrain; Hyp, hypothalamus (c, caudal; r, rostral; v, ventral); pTh, prethalamus; Sep, septal region; Tec, midbrain tectum; Tel, telencephalon. Scale bar: 100 µm. EXPRESSION / LABELING:
|

bsx is expressed in all cell types of the PC except projection neurons. (A-F″) Double-fluorescent WISH of 3 dpf wild-type zebrafish embryos detects expression of bsx (magenta, A-F), PC type-specific marker genes (as indicated in green, A′-F′), and merged channels (A″-F″). All panels show single confocal planes (image depth z=1 µm; anterior is to the top). n≥2 for all. Maximum intensity projections of stacks are shown in Fig. S3. Scale bar: 20 µm. EXPRESSION / LABELING:
|

Bmp but not Wnt signaling regulates bsx expression in the PC. (A-D,I-L′) Transgenic embryos (as indicated in boxes) and wild-type control siblings were heat-shocked for 1 h from 12 to 13 hpf and fixed either at 16 hpf (A-D) or 24 hpf (I-L′). (E-H) Embryos were treated with the Wnt inhibitor IWR-1 from 2 hpf onwards and fixed at 24 hpf. bsx or flh expression were detected by WISH as indicated. (A-H,I′,J′,K′,L′) Dorsal views, orientations as indicated in (A); (I,J,K,L) lateral views, orientations as indicated in (J). Numbers for representative phenotype shown and embryos analyzed: (A) 19/19, (B) 20/20, (C) 14/14, (D) 17/17, (E) 18/18, (F) 14/14, (G) 19/19, (H) 13/15, (I,I′) 26/26, (J,J′) 27/27, (K,K′) 16/16 and (L,L′) 15/16. Scale bars: 100 µm. EXPRESSION / LABELING:
PHENOTYPE:
|

Absence of parapineal cell cluster and habenula right-isomerism in embryos homozygous for a targeted bsx mutant allele. (A-G) Expression of PC or habenula markers analyzed by WISH in wild-type and bsx mutant embryos at 3 dpf (A-B′,D-E′,G,G′), 34 hpf (C,C′) or 5 dpf (F,F′). Arrowheads indicate the location of PP cells. All embryos were genotyped [n≥4 each for wild type (wt) and mutants]. Dorsal views, with the anterior at the top. (H) Time series of pineal anlage in Tg(foxd3:GFP) at stages (indicated at left) when the PP develops. In wt but not bsx mutant embryos, GFP+ cells migrate out of the anterior pineal anlage to form a PP cell cluster (arrowhead). Widefield epifluorescence images (20× lens, NA 1.0) of PC, dorsal views, with the anterior at the top. L, left; R, right. Scale bars: 100 µm (A-G) and 50 µm (H). |

Epistatic positioning of bsx in the PC transcriptional network. (A-R) Expression of mRNAs encoding PC transcription factors or signals analyzed by WISH at indicated stages. Genotypes of embryos were wild type, single, or double mutant for bsx and flh, as indicated at top. The genes for which expression was analyzed are given on the left. Anterior is to the top of the images. Analyzed embryos n≥3 for wild type, n≥4 for bsx or flh single mutants and n≥2 for bsx/flh double mutants. Scale bars: 20 µm. EXPRESSION / LABELING:
|

Abnormal PC cell differentiation in bsx mutant embryos. (A,B) Immunofluorescence for GFP (labeling cone-like PhR cells and PNs) and Arr3a (labeling cone-like PhR cells) using Tg(foxD3:GFP) wild-type or bsx mutant embryos fixed at 78 hpf. Maximum-intensity projections. (C-D‴) Combined anti-HuC (labeling PNs) and anti-GFP immunofluorescence and TOTO3 nuclear staining of Tg(foxD3:GFP) wild-type or bsx mutant embryos fixed at 78 hpf. Images are maximum-intensity z-projections of 41 µm confocal stacks encompassing the PC (see Movie 1). (E,F) Average cell numbers±s.d. of GFP+ (green), HuC+ (red) and double-positive (yellow) cells of wild-type (E) and bsx mutant (F) embryos shown in C-D‴ (n=7 embryos). (G,H) Immunofluorescence for GFP using Tg(foxD3:GFP) wild-type or bsx mutant embryos fixed at 78 hpf. Maximum-intensity projections of confocal image stacks of PG cells and neurites originating from the PG are shown. (I) GFP+ neurites of PNs in Tg(foxD3:GFP) bsx mutant or control embryos were counted. Graph shows average number of neurites per side (left or right hemisphere). Error bars indicate s.d. ****P≤0.0001 as revealed by Wilcoxon–Mann–Whitney test. (J-Q) WISH expression analysis of genes encoding enzymes involved in melatonin biosynthesis (J-O) or Agrp2 neuropeptide (P,Q) in wild-type and bsx mutant embryos at 84 hpf (J,K) or 72 hpf (L-Q). Anterior is at the top of the images. All embryos were genotyped. (A,B,J-Q) n≥4 embryos each for wild type and mutants. Scale bars: 20 µm (A-D‴) and 50 µm (G,H,J-Q). EXPRESSION / LABELING:
PHENOTYPE:
|
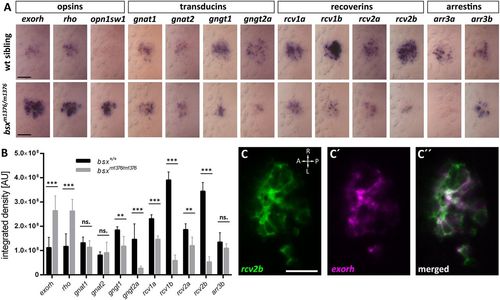
Expression of genes encoding phototransduction factors is altered in bsx mutants. (A) Expression of phototransduction factor genes was analyzed by WISH in embryos at 78 hpf. Genotypes are indicated on the left and gene expression analyzed is indicated above the images. At the top, different biochemical classes of phototransduction factors are indicated. Anterior is to the left of each image. For each genotype and gene expression, n=7 embryos were analyzed. (B) For each individual stained embryo, stain density was measured and integrated over the PC region to evaluate changes in the number of cells expressing a marker or in expression level (method outline in Fig. S10). Significance was determined through Wilcoxon–Mann–Whitney test. **P≤0.01; ***P≤0.001. ns, not significant. (C-C″) Single z-plane (1.5 µm) from confocal stack of wild-type PG (dorsal view) fixed 3 dpf and analyzed by double-fluorescent WISH for expression of rcv2b [(C) green], exorh [(C′) magenta]; (C″) shows merged channels. Orientations as indicated in (C). Scale bars: 30 µm (A) and 20 µm (C-C″). EXPRESSION / LABELING:
PHENOTYPE:
|
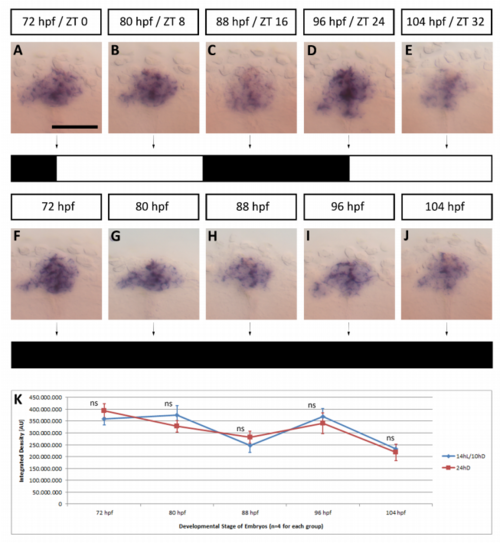
bsx mRNA tissue levels reveal little or no circadian rhythm regulation. (A-E) Embryos were fixed at ages indicated in hours post fertilization (hpf) and at indicated zeitgeber time (ZT) with reference to 14 h light on / 10 h light off cycle during incubation. (F-G) Same experiment but embryos incubated in constant darkness from 2 hpf on. Zeitgeber time 0 was defined as the timepoint of light onset (for the light-entrained group) on the third day. (A-J) Fixed embryos were stained by in situ hybridization using bsx probe. Dorsal views of pineal complex in embryos, anterior is to the top. Scale bar: 50 µm. bsx expression shows little or no variation in intensity over the course of the day (n≥20 embryos for each condition). (K) Background adjusted integrated staining density in the pineal complex area of embryos kept in a 14 h light / 10 h dark cycle (blue) and embryos raised in complete darkness (red). Wilcoxon-Mann-Whitney test revealed no significant differences in staining intensity between the two groups at any of the assessed timepoints: p = 0.2000 (72 hpf), p = 0.0571 (80 hpf), p = 0.1143 (88 hpf), p = 0.4857 (96 hpf), p = 0.3429 (104 hpf). |

Evaluation of expression domains of bsx and pineal differentiation marker genes. Double fluorescent in situ hybridization using 3 dpf wildtype embryos reveals bsx (A-F, magenta) and differentiation marker (A’-F’, green) expression (both channels A’’ - F’’). Images show maximum intensity projections of dorsal view confocal image stacks of pineal complex (same stacks from which single planes are shown in Fig. 2). The z-projections suggest clustering of specific cell types in the pineal complex. We integrated this clustering into our model of pineal complex cell type organisation (Fig. 8B). For each marker, two or more embryos were analyzed. Scale bar: 20 µm. |

bsx expression in embryos with altered Nodal signaling. (A-D) bsx expression analyzed by whole mount in situ hybridization, dorsal views, anterior at top; scale bar: 50 µm. (A) bsx is expressed normally (see Fig. 1D) in the pineal gland in GFP encoding mRNA injected wildtype control embryos at 30 hpf (n=18/18). (B) In embryos injected with lefty mRNA, bsx is expressed in two bilateral domains in the putative pineal anlage at 30 hpf in embryos (n=23/26), which may be caused by the fact that the neural tube fails to close in lefty overexpressing embryos. (C) At 2 dpf bsx is expressed asymmetrically in the parapineal on the left side of the pineal complex of wildtype siblings or ntlb160 heterozygous embryos (phenotypically considered wildtype siblings). (D) in contrast, in ntlb160 homozygous siblings, sidedness of parapineal bsx expression appears to be randomized, as the bsx domain was found in n=5/12 embryos on the right side of the pineal (parapineal cells were displaced to the left in 6/12 embryos; 1/12 embryos showed bsx expression only in the pineal gland and not displaced from the midline). |

Evaluation of biological activities of bsx wildtype mRNA and bsx m1376 mRNA by microinjection at one-cell state. (A-C) Embryos were injected with bsx wildtype or bsx m1376 mRNA in combination with gfp mRNA, such that in a first injection series a total of 15 pg mRNA, and in a second series a total of 40 pg mRNA were injected into each embryo. Embryos were analyzed at 24 hpf and the phenotypes classified into “normal or almost normal body axis” (examples show in (B)), “severely shortened or no elongated axis at all” (examples show in (C)), or “dead”. Scale bar in B for B,C: 500 µm. (A) Graph displays proportions of phenotypic classes at 24 hpf in all embryos injected. Embryos were injected with 5 pg synthetic bsx wildtype mRNA and 10 pg gfp mRNA, 5 pg synthetic bsx m1376 mRNA and 10 pg gfp mRNA or 15 pg gfp mRNA as control. Additionally, embryos were injected 30 pg synthetic bsx wildtype mRNA and 10 pg gfp mRNA, 30 pg synthetic bsx m1376 mRNA and 10 pg gfp mRNA or 40 pg gfp mRNA as control. Chi-square test (GraphPad Prism) revealed significant differences between bsx wildtype mRNA injected embryos and controls at both 5 pg and 30 pg amounts injected (p < 0.0001). In contrast no significant differences were detected between phenotypes of bsx m1376 mRNA and control injected embryos at both 5 and 30 pg bsx m1376 mRNA injected (p = 0.5232 and p = 0.1085, respectively). These findings suggest that bsx m1376 mRNA lacks the biological activity of Bsx. |
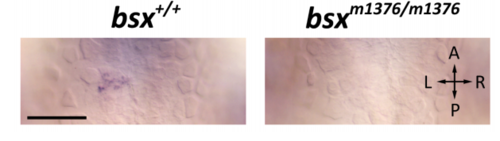
sox1a is not expressed in the pineal complex of bsx mutants at 30 hpf. Premigratory parapineal cells can be labelled in wildtype embryos (n = 11/11) at 30 hpf by in situ hybridization using sox1a mRNA probe. In bsx mutant embryos no sox1a expression can be detected in the pineal complex at 30 hpf (n = 11/11). |

Analysis of epistatic position of bsx function in pineal complex development. (A-H,K-P) Dorsal views of embryos at 2 dpf after whole mount in situ hybridization. Anterior is to the top. Scale bar: 50 µm. (A,B) bsx expression is normal in embryos injected with otx5 morpholino (MO) (n=21/21) when compared to embryos injected with standard control MO (n=35/35). (C,D) otx5 MO function was confirmed through downregulation of irbp expression (n=22/24) in comparison to std ctrl MO injected embryos (n=34/34). (E) bsx is expressed in both pineal gland (PG) and parapineal (PP) in std ctrl MO injected embryos at (n=31/31). (F) In most of tbx2b MO injected embryos only PG bsx expression and no PP bsx expression was observed (n=41/43), in the other two embryos left-sided bsx expression was detected, but was weaker than in control embryos. (G) bsx expression is grossly normal in embryos injected with pitx2c MO (n=50/56). (H) bsx expression is also normal in embryos injected with nr2e3 MO (n=34/41). (I) Splice blocking activity of nr2e3 MO was confirmed through PCR (see Material and Methods section for details). (J) bsx expression in pineal complex of morphologically normal siblings in fgf8ati282a heterozygous incross (n=31/33). (K) No PP bsx expression is observed in embryos homozygous for the fgf8ati282a allele (n=10/10). (L) opn1sw1 is not expressed in the PG of std ctrl MO injected embryos (n=14/14). (M) otx5 knockdown by MO does not result in PG expression of opn1sw1 (n=26/26). (N) Heterozygous or wildtype siblings of bsx mutants do not express opn1sw1 in the PG (n=32/32). (O) Strong PG opn1sw1 is observed in all bsx mutant embryos (n=12/12). |

Expression of tph2 in bsx mutants is selectively lost in the pineal gland. (A) Biochemical steps in the biosynthesis pathway of melatonin from the essential dietary amino acid Ltryptophan, catalyzed by the enzymes Tryptophan hydroxylase (TPH), Aromatic L-amino acid decarboxylase (AADC), Aralkylamine N-acetyltransferase (AANAT) and Acetylserotonin Omethyltransferase (ASMT). (B,C) Dorsal views of embryos at 3 dpf after in situ hybridization against tph2. Anterior is to the left. Scale bar: 100 µm. Expression of tph2 in the pineal gland is completely lost in bsx mutants (arrowhead), while tph2 expression in the midbrain raphe nucleus is normal (asterisk) (n≥6 embryos for each genotype). |

bsx mutant larvae exhibit no increase in apoptosis in the pineal complex. (A-D) Tg(foxD3:GFP) embryos at (A,B) 30 hpf or (C,D) 72 hpf fixed and stained for apoptosis by TUNEL staining. Dorsal views, anterior to the left. Scale bar: 100 µm. Images show superimposition of widefield epifluorescence for detection of GFP (maximum intensity projections of all z-planes encompassing the pineal complex), and transmitted light DIC images for chromogenic TUNEL stain (minimum intensity projection of all z-planes encompassing the pineal complex). Apoptosis in the pineal complex is low in both wildtype and bsx mutant embryos (n≥2 for all stages and genotypes). |

Quantification of whole-mount in situ hybridization staining. In order to evaluate stain intensity and stain area as measure for mRNA expression region and level, we quantified the WISH stains by integrating the grey values of images over the area of the pineal complex and subtracting background stain intensities. (1.) Image stacks were acquired on AxioPlan (Zeiss) widefield transmitted light microscope using low DIC contrast settings and 1 µm z-planes. (2.) Minimum intensity projections of 25 z-planes encompassing the pineal gland were generated. (3.) The z-projection image was converted to 8-bit grey-scale. (4.) The grey-scale image was inverted. Next, a circle with 80 µm diameter was drawn encompassing the pineal gland, and a second circle with 100 µm diameter was drawn surrounding the smaller circle. (5.) Using ImageJ, the Integrated Density (IntDen) was determined for both circles. (6.) Pixel value threshold for background subtraction was calculated. (7.) Image histogram clipping was performed using the background threshold as a lower limit. (8.) Integrated density of inner circle was determined from adapted picture. (9.) Integrated density of pineal gland after background subtraction was used as quantification of stain and used for statistical analysis. |
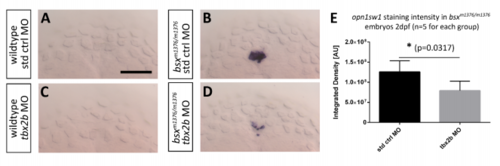
Knock-down of tbx2b reduces the ectopic opn1sw1 expression in bsx mutant embryos. (A-D) Dorsal view on embryos 2 dpf after in situ hybridization using opn1sw1 probe. (A) Wildtype embryos injected with standard control morpholino do not express opn1sw1 in the pineal gland, and neither do (C) embryos after tbx2b morpholino injection. (B) Ectopic pineal gland expression of opn1sw1 in bsx mutant embryos is (D) significantly decreased after injection of tbx2b morpholino. (E) Measurements of integrated staining intensities (see Fig.S10) of opn1sw1 in the pineal complex reveal that the effect of tbx2b morpholino knockdown is significant (Wilcoxon-Mann-Whitney test). (A-D) Anterior is to the top. Scale bar: 50 µm. |