
- Title
-
Functional roles of the Ripply-mediated suppression of segmentation gene expression at the anterior presomitic mesoderm in zebrafish
- Authors
- Kinoshita, H., Ohgane, N., Fujino, Y., Yabe, T., Ovara, H., Yokota, D., Izuka, A., Kage, D., Yamasu, K., Takada, S., Kawamura, A.
- Source
- Full text @ Mech. Dev.
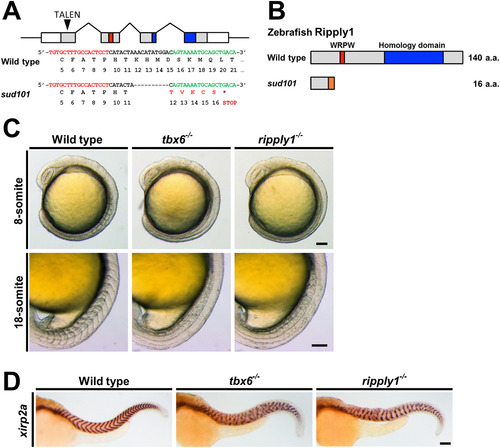
Defective somite segmentation in zebrafish ripply1 mutants. (A) Schematic representation of the ripply1 genomic locus and TALEN target site. The genomic structure of zebrafish ripply1 is composed of four exons. Nucleotides corresponding to the open reading frame (grey), WRPW motif (red), and Ripply homology domain (blue) are indicated. The arrowhead points to the position of the TALEN-target site in the first exon. The nucleotide sequence in the first exon and its translated amino acid and the TALEN targets (left, red; right, green) used in this study are shown below the drawing. In the sud101 allele, a 10-bp deletion induced by TALEN pairs results in a frameshift at the 12th amino acid of Ripply1 and an additional five abnormal amino acids (red) followed by the termination codon. (B) Schematic diagrams of the Ripply1 protein encoded by wild-type and sud101 alleles. The WRPW motif (red) and Ripply homology domain (blue) are shown. In the sud101 allele, five abnormal amino acids due to the frame-shift are shown as an orange box. (C) Lateral views of wild-type, tbx6−/−, and ripply1−/− embryos at the 8-somite and 18-somite stages. (D) Representative lateral images of wild-type, tbx6−/−, and ripply1−/− embryos at 36 hpf stained with a segment boundary marker, xirp2a/cb1045. Scale bars in C and D represent 100 μm. EXPRESSION / LABELING:
PHENOTYPE:
|
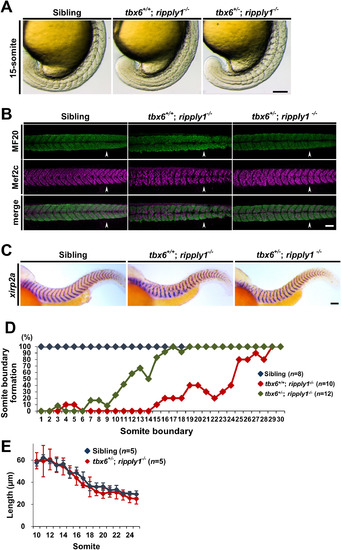
Heterozygous mutation of tbx6 in ripply1 homozygous mutants partially suppresses the defects of somite segmentation. (A) Lateral views of sibling, tbx6+/+; ripply1−/−, and tbx6+/−; ripply1−/− embryos at the 15-somite stage that were obtained by intercrosses between tbx6 and ripply1 double heterozygous mutants. After taking photos, the genotype of each embryo was determined by the heteroduplex mobility shift assay or DNA sequencing. (B) Immunostaining showing myotomes of sibling, tbx6+/+; ripply1−/−, and tbx6+/−; ripply1−/− embryos at 36 hpf using MF20 (myosin heavy chain, green) and anti-Mef2c (Myocyte enhancer factor 2, magenda) antibodies. Arrowhead indicates the posterior end of yolk extension. Anterior is to the left and dorsal is to the top. (C) Representative images of sibling, tbx6+/+; ripply1−/−, and tbx6+/−; ripply1−/− embryos at 36 hpf stained with a segment boundary marker, xirp2a/cb1045. Lateral views and anterior is to the left. (D) Distribution of somite boundary formation in sibling, tbx6+/+; ripply1−/−, and tbx6+/−; ripply1−/− embryos at 36 hpf. See Materials and methods. (E) The horizontal lengths of the somites were compared between sibling and tbx6+/−; ripply1−/− embryos. After staining with xirp2a, the intervals of somites (10th–25th segments) along the horizontal myoseptum of sibling and tbx6+/−; ripply1−/− embryos at 36 hpf were measured by ImageJ software. Scale bars in A, B, and C are 100 μm. EXPRESSION / LABELING:
PHENOTYPE:
|
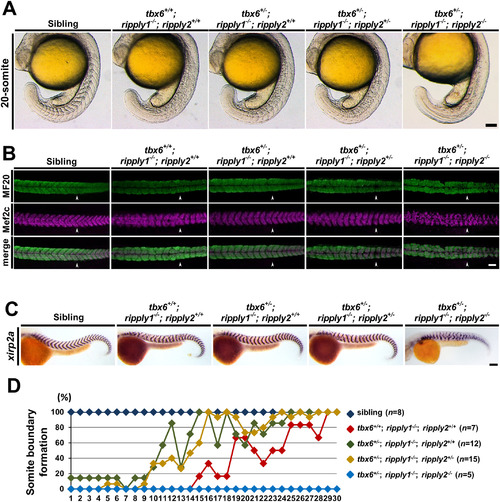
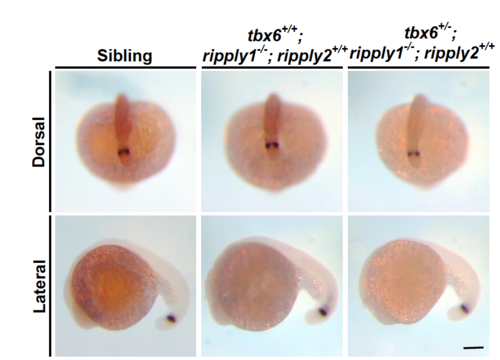
Recovery of the somite boundary in tbx6+/−; ripply1−/− embryos depends on ripply2. (A) Lateral views of sibling, tbx6+/+; ripply1−/−; ripply2+/+, tbx6+/−; ripply1−/−; ripply2+/+, tbx6+/−; ripply1−/−; ripply2+/−, and tbx6+/−; ripply1−/−; ripply2−/− embryos at the 20-somite stage. These embryos were obtained by intercross between tbx6+/−; ripply1+/−; ripply2+/− triple heterozygous mutants. (B) Immunostaining of the myotomes of sibling, tbx6+/+; ripply1−/−; ripply2+/+, tbx6+/−; ripply1−/−; ripply2+/+, and tbx6+/−; ripply1−/−; ripply2+/− embryos at 36 hpf using MF20 and anti-Mef2c antibodies. The arrowhead shows the posterior end of the yolk extension. Anterior is to the left. (C) Expression patterns of a segment boundary marker, xirp2a, in sibling, tbx6+/+; ripply1−/−; ripply2+/+, tbx6+/−; ripply1−/−; ripply2+/+, tbx6+/−; ripply1−/−; ripply2+/−, and tbx6+/−; ripply1−/−; ripply2−/− embryos at 36 hpf. (D) Distribution of somite boundary formation in tbx6+/+; ripply1−/−; ripply2+/+, tbx6+/−; ripply1−/−; ripply2+/+, tbx6+/−; ripply1−/−; ripply2+/−, and tbx6+/−; ripply1−/−; ripply2−/− embryos at 36 hpf. Scale bars in A, B, and C are 100 μm. EXPRESSION / LABELING:
PHENOTYPE:
|
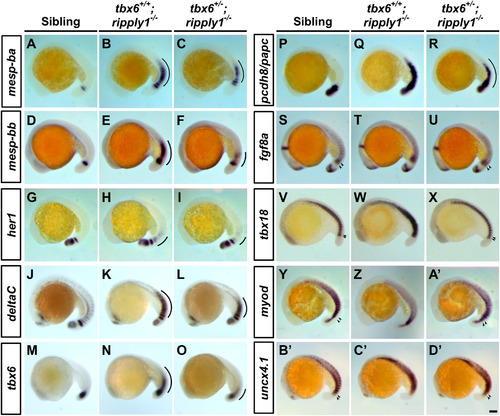
Expression of segmentation genes in the PSM is not fully suppressed in tbx6+/−; ripply1−/− mutants. Expression patterns of mesp-ba (A–C), mesp-bb (D–F), her1 (G–I), deltaC (J–L), tbx6 (M–O), pcdh8/papc (P–R), fgf8a (S–U), tbx18 (V–X), myod (Y–A′), and uncx4.1 (B′–D′) in sibling, tbx6+/+; ripply1−/−, and tbx6+/−; ripply1−/− embryos were examined by whole-mount in situ hybridization at the 18–22-somite stage. A line shows the ectopic expression of segmentation genes in the paraxial mesoderm. The arrowhead shows the polarized expression of somite polarity markers at the anterior PSM. Scale bar in D′ is 100 μm. All of the photos were taken at the same magnification. Higher magnification of the photos (S–D′) is shown in the Supplementary Fig. 7. EXPRESSION / LABELING:
PHENOTYPE:
|
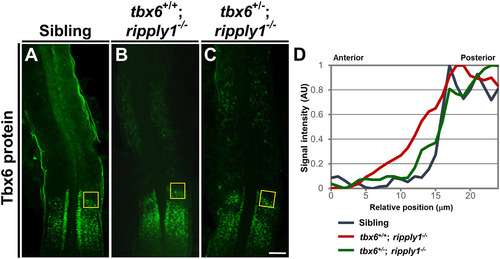
Immunostaining of Tbx6 protein in the PSM of sibling, tbx6+/+; ripply1−/−, and tbx6+/−; ripply1−/− embryos. Immunohistochemistry was carried out using an anti-Tbx6 antibody. Sibling (A), tbx6+/+; ripply1−/− (B), and tbx6+/−; ripply1−/− (C) embryos at the 15-somite stage were examined. The tbx6+/−; ripply1−/− embryos that clearly exhibited recovered somite boundaries were used for analysis. Deyolked embryos were flat-mounted on slide glasses. Dorsal views and the anterior is to the top. Scale bar is 100 μm. (D) Spatial qualifications of Tbx6 signal around the anterior border of Tbx6 domains in the PSM of sibling, tbx6+/+; ripply1−/−, and tbx6+/−; ripply1−/− embryos. In the boxed areas shown in A, B, and C, the intensity of Tbx6 signals along the anterior-posterior axis was measured by ImageJ software, and the relative intensity was shown. EXPRESSION / LABELING:
PHENOTYPE:
|
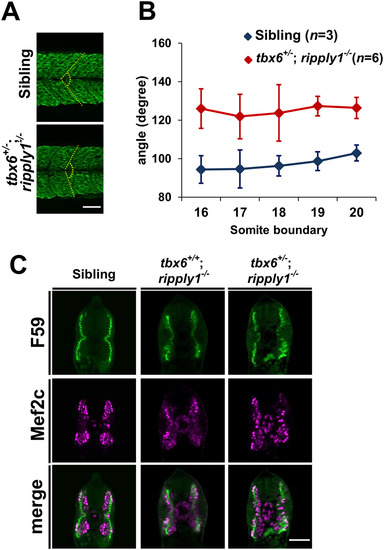
Myogenesis is perturbed in tbx6+/−; ripply1−/− mutants. (A) A myotome stained with MF20 antibody at 36 hpf. The yellow-dashed line was drawn to emphasize the segment boundary and the chevron angle in sibling and tbx6+/−; ripply1−/− embryos. (B) Graph showing the chevron angles in 16th to 20th segments in sibling and tbx6+/−; ripply1−/− embryos. (C) Transverse sections stained with anti-Mef2c and F59 antibodies. Zebrafish body corresponding to the 16th to 20th myotomes at 24 hpf was used for analysis. The signal around the notochord is non-specific signal. Scale bar is 100 μm. |
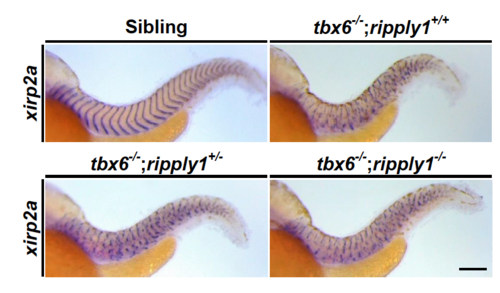
Defective somite segmentation is comparable between tbx6-/-; ripply1+/+and tbx6-/-; ripply1-/-embryos. The segment boundaries oftbx6-/-; ripply1+/+, tbx6-/-; ripply1+/-, and tbx6-/-; ripply1-/-embryos at 36 hpfwere visualized by in situ staining using xirp2a/cb1045 probe. Lateral views and anterior is to the left. The photos were taken at the same magnification. Scale bar is 100 mm. |

Segmental defects in ripply1sud101/kt1032transheterozygousmutants are suppressed by heterozygous mutation of tbx6. Lateral views of sibling, tbx6+/+;ripply1sud101/kt1032, tbx6+/-;ripply1sud101/kt1032embryos at the 24-somite stage. The embryos were obtained by crossing tbx6+/-; ripply1+/sud101with tbx6+/+;ripply1+/kt1032fish. The arrowhead shows recovery of the somite boundary. Scale bars are 100 mm. PHENOTYPE:
|

Segmental defects in ripply1kt1032/kt1032mutants are suppressed by heterozygous mutation of tbx6. Whole-mount in situ hybridization was carried out to visualize the segment boundaries in sibling, tbx6+/+;ripply1kt1032/kt1032, tbx6+/-;ripply1kt1032/kt1032embryos at 36 hpf. The embryos were obtained by crossing tbx6+/-; ripply1+/kt1032fish with tbx6+/+;ripply1+/kt1032fish. Lateral views. Scale bar is 100 mm. |
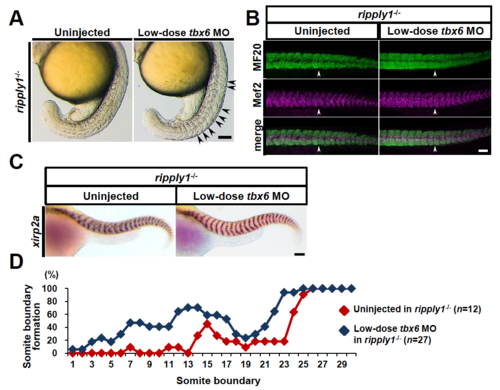
Somite segmentation defects in ripply1 homozygous embryos were rescued by partial knockdown of tbx6. (A) Lateral views of uninjectedand low-dose tbx6 MO-injected ripply1-/- embryos at the 20-somite stage. tbx6MO was injected at a low dose (concentration of 0.5 mg/ml) into blastomeresof fertilized embryos obtained by intercross between ripply1homozygous fish. (B) Immunohistochemistry of the myotomes of uninjectedand low-dose tbx6MO-injected ripply1-/-embryos at 36 hpfusing MF20 and anti-Mef2c antibodies. The arrowhead shows the posterior end of the yolk extension. Anterior is to the left. (C) Representative images of uninjectedembryos and low-dose tbx6MO-injected ripply1-/-embryos at 36 hpf. The somite boundary was visualized by in situstaining with xirp2a/cb1045 antisense probe. (D) Distribution of somite boundary formation in uninjectedripply1-/-and tbx6 MO-injected ripply1-/-embryos. In the low-dose tbx6MO-injected embryos, the stained embryos showing recovery of the somite boundary were examined. See Materials and Methods for the details of this analysis. Scale bars in A, B, and C are 100 mm. EXPRESSION / LABELING:
PHENOTYPE:
|
Expression patterns of zebrafish ripply2in sibling, tbx6+/+; ripply1-/-, and tbx6+/-; ripply1-/-embryos. Whole-mount in situ hybridization was performed to examine the expression patterns of ripply2 in sibling, tbx6+/+; ripply1-/-, and tbx6+/-; ripply1-/- embryos at the 18-somite stage. Scale bar is 100 mm. EXPRESSION / LABELING:
|

Expression patterns of mesp-bain sibling, tbx6+/+; ripply1-/-, and tbx6+/-; ripply1-/- embryos during embryogenesis. Expression patterns of mesp-ba in sibling, tbx6+/+; ripply1-/-, and tbx6+/-; ripply1-/- embryos during the segmentation period were examined by whole-mount in situ hybridization. Bracket shows the ectopic expression of mesp-ba in the paraxial mesoderm. Scale bars are 100 mm. EXPRESSION / LABELING:
|
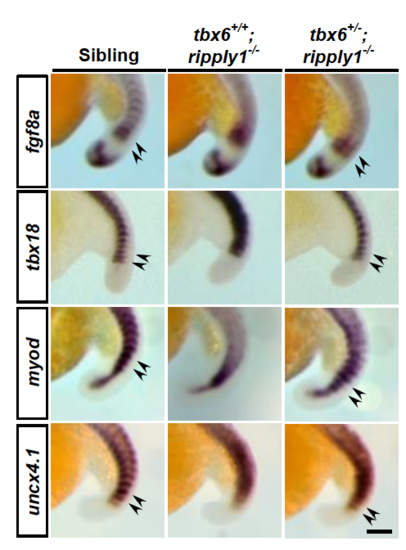
Expression patterns of uncx4.1, tbx18, myod, and uncx4.1 in the PSM of sibling, tbx6+/+; ripply1-/-, and tbx6+/-; ripply1-/- embryos at the 18–22-somite stages. Higher magnification of the photos shown in Fig. 4S-D’. Scale bar is 100 mm. EXPRESSION / LABELING:
PHENOTYPE:
|

Expression patterns of uncx4.1 in sibling, tbx6+/+; ripply1-/-, and tbx6+/-; ripply1-/- embryos at the 6-and 20–22-somite stages. Whole-mount in situ hybridization was performed to investigate the expression patterns of uncx4.1 in sibling, tbx6+/+; ripply1-/-, and tbx6+/-; ripply1-/- embryos. The arrowhead shows the polarized expression of uncx4.1 in the anterior PSM. Scale bar, 100 mm. EXPRESSION / LABELING:
PHENOTYPE:
|
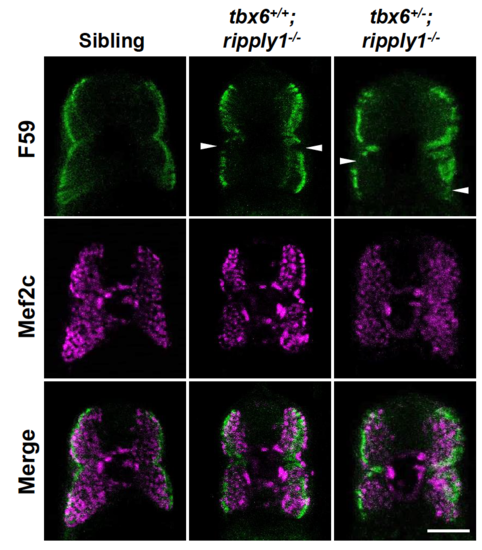
Immunostaining of slow muscle cells (F59) in sibling, tbx6+/+; ripply1-/-, and tbx6+/-; ripply1-/- embryos at 2 day post fertilization. Transverse sections stained with F59 antibody (green) and anti-Mef2c antibody (magenta). The arrowhead shows the large gap between slow muscle cells in tbx6+/+; ripply1-/-, and tbx6+/-; ripply1-/- embryos . Scale bar, 100 mm. |
Reprinted from Mechanisms of Development, 152, Kinoshita, H., Ohgane, N., Fujino, Y., Yabe, T., Ovara, H., Yokota, D., Izuka, A., Kage, D., Yamasu, K., Takada, S., Kawamura, A., Functional roles of the Ripply-mediated suppression of segmentation gene expression at the anterior presomitic mesoderm in zebrafish, 21-31, Copyright (2018) with permission from Elsevier. Full text @ Mech. Dev.