
- Title
-
Non-canonical mTOR-Independent Role of DEPDC5 in Regulating GABAergic Network Development
- Authors
- Swaminathan, A., Hassan-Abdi, R., Renault, S., Siekierska, A., Riché, R., Liao, M., de Witte, P.A.M., Yanicostas, C., Soussi-Yanicostas, N., Drapeau, P., Samarut, É.
- Source
- Full text @ Curr. Biol.

depdc5 Is Essential for Survival (A) Whole-mount in situ hybridization showing expression of depdc5 at different stages of development. (B) Electropherograms showing confirmation of the 4-bp insertion by Sanger sequencing. (C) Expression of depdc5 transcript in 7-dpf depdc5+/+, +/−, and −/− larvae. N = 3; Student’s t test: p(WT versus heterozygote [HT]) = 0.0026; p(WT versus homozygote [HM]) = 0.001. (D) Survival curve showing that depdc5−/− embryos have reduced survival, with most larvae dying around 14 dpf (N = 2, n = 15 per genotype). (E) Images showing that depdc5−/− larvae do not show gross morphological changes at 3 dpf. (F) Measurement of body length (top; n = 20/genotype; p = 0.0045 by unpaired Student’s t test) and eye size (bottom; n = 12/genotype; p = 0.7219 by unpaired Student’s t test) showed no significant change in either parameter. EXPRESSION / LABELING:
PHENOTYPE:
|

depdc5 Knockout Results in Increased mTOR Activity, Hypoactivity, Epileptiform Discharges, and Seizure Susceptibility (A) Western blotting of 7-dpf larval lysates to examine phospho-S6 levels in depdc5+/+, depdc5+/−, and depdc5−/− larvae showing hyperactivation of mTOR signaling. n = 3; p(WT vs HT) = 0.0012; p(WT vs HM) = 0.0455. (B) Images of 6-dpf depdc5+/+ and depdc5−/− larval brains (transversal sections across the optic tectum) immunostained with phospho-S6 antibodies and counterstained with DAPI. The panels on the extreme right depict 3D reconstruction of single cells in depdc5+/+ and −/− brains. Scale bars from left to right: 20 μm, 2.5 μm, and 1.5 μm. (C) Spontaneous extracellular electrographic activity recorded from the optic tectum of depdc5+/+ or depdc5−/− larvae at 9 dpf showing representative epileptiform activity of depdc5−/− larvae displaying polyspiking discharges. (D) Percentage of depdc5+/+ and depdc5−/− larvae showing epileptiform activity in the brain. N = 4, n = 10/genotype; Student’s t test p(WT vs HM) < 0.0001. (E) Distance swam by 8-dpf larvae across two 2-hr dark/4-hr light cycles. (F) Spontaneous coiling activity in 20-hpf embryos monitored over 20 min represented as the percentage of total time during which the embryos were active. N = 3, n = 20; Student’s t test p(WT versus HM) < 0.0001. (G) Distance swam by 2-dpf embryos upon exposure to 3 mM PTZ represented as fold change compared to basal distance swam by wild-type larvae at t0. N = 3, n > 10; Student’s t test, ∗p < 0.05. (H) Representative swimming tracks of 2-dpf embryos during a 10-min period following a 3 mM PTZ exposure (tracks of 3 replicates are shown in rows for each genotype). PHENOTYPE:
|

depdc5 Knockout Alters Gene Expression in Larval Brains without Affecting Brain Morphology (A) Volcano plot showing the differentially expressed gene expression profile between depdc5+/+ and depdc5−/− larval brains. See also Table S1. (B) Pathways showing high enrichment in the differentially expressed genes (upregulated are shown in green; downregulated are in red). (C) Whole-mount images of depdc5+/+ and −/− larvae at different stages of development immunostained with α-acetylated tubulin (n > 3/genotype/developmental stage). Scale bars, 40 μm. (D) Measurement of head size and head surface area in 3-dpf depdc5+/+ and depdc5−/− larvae. (E) Whole-mount images of 48-hpf depdc5+/+ and −/− larvae immunostained with α-phosphorylated histone H3 (n > 3/genotype). (F) Cresyl violet staining comparing 7-dpf depdc5+/+ (top half) and depdc5−/− (bottom half) larval heads showed no gross difference in the density of cells in the brain. Scale bar, 100 μm. |
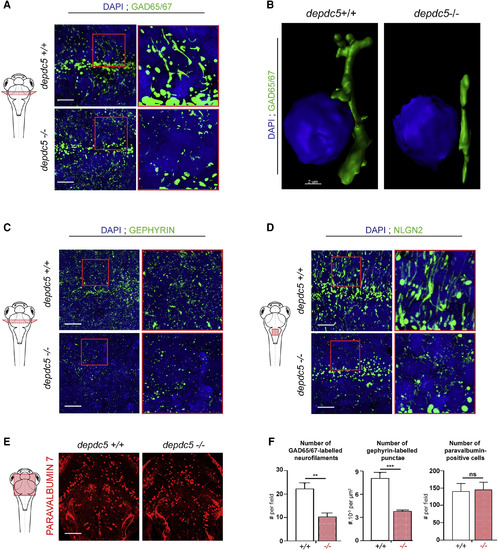
Defects in GABAergic Networks in depdc5 Knockout Zebrafish Brains (A, C, and D) Images of transverse sections of 6-dpf depdc5+/+ and depdc5−/− embryos immunostained with GAD65/67 (A), gephyrin (C), and Nlgn2 (D) antibodies and counterstained with DAPI. Section level is displayed in the schematic drawing. Regions indicated in red boxes have been magnified to show the branching defects; N = 3, n = 3 embryos/genotype. Scale bars, 10 μm. (B) Imaris-reconstructed 3D images with Gad65/67-positive GABAergic boutons shown in green projecting toward the nucleus (DAPI) shown in blue. Scale bar, 2 μm. (E) Images of longitudinal sections of 6-dpf depdc5+/+ and depdc5−/− embryos immunostained with parvalbumin 7 antibody. Scale bar, 25 μm. Field of view is displayed in the schematic drawing. (F) Quantification of the number of GAD65/67-positive neurofilaments, gephyrin-positive puncta, and parvalbumin-positive cells in depdc5+/+ and −/− larval brain sections; N = 3, n > 3 embryos/genotype. |
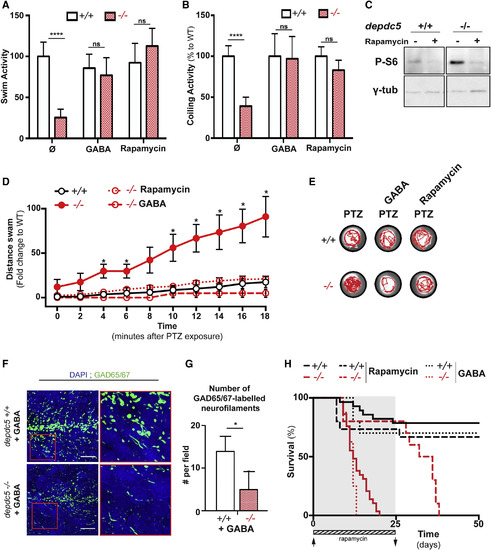
Rescuing Effect of GABA and Rapamycin on depdc5 Knockout Zebrafish (A) Swimming activity of 8-dpf larvae, with the activity of depdc5+/+ larvae normalized to 100%, shows that treatment with GABA (100 μM) can completely rescue hypoactivity; N = 2, n = 20/genotype/treatment. Rapamycin treatment (100 nM from day 0 to 2, 300 nM from day 3 onward) was used as a positive control. (B) Spontaneous coiling activity in 20-hpf embryos shows that the hypoactivity of depdc5−/− embryos is rescued by treating with 100 nM rapamycin or with 100 μM GABA from the single-cell stage. N = 2, n = 20/genotype/treatment; Student’s t test, ∗∗∗∗p(control WT versus HM) < 0.0001. Coiling activity of depdc5+/+ was set at 100% for each sample, and the relative activity of the depdc5−/− larvae is represented. (C) Western blotting of 9-dpf larval lysates to examine phospho-S6 levels in depdc5+/+ and depdc5−/− larvae treated with DMSO or rapamycin (100 nM from day 0 to 2, 300 nM from day 3 onward) shows inhibition of mTOR signaling upon rapamycin treatment. (D) Distance swam by 2-dpf larvae treated with GABA (100 μM) or rapamycin (100 nM) upon PTZ exposure (3 mM). N = 3, n > 10. (E) Representative swimming tracks of 2-dpf embryos (untreated or treated with GABA or rapamycin) during a 10-min period following PTZ exposure (3 mM). (F) Images of transverse sections of 7-dpf GABA-treated depdc5+/+ and depc5−/− larval brains immunostained with α-GAD65/67 and counterstained with DAPI. Regions indicated in red boxes have been magnified to show the branching defects. GABA treatment (100 μM) was begun at 8 hpf; n = 3 embryos/genotype. Scale bar, 10 μm. (G) Quantification of the number of GAD65/67-positive neurofilaments in GABA-treated depdc5+/+ and −/− larval brain sections showing that GABA treatment does not rescue the defects in depdc5−/−. (H) Survival curve showing that treatment of depdc5−/− larvae with rapamycin (100 nM from day 0 to 2, 300 nM from day 3 onward) first prolongs lifespan as long as rapamycin is supplemented in the water (until day 25; shaded). Withdrawal of rapamycin results in a drop in survival, and all the larvae die by day 35. On the contrary, treatment with 100 μM GABA from 8 hpf does not extend survival. Neither rapamycin nor GABA affected depdc5+/+. EXPRESSION / LABELING:
PHENOTYPE:
|

Paracrine Compensation by GABA and Modulation of Multiple Independent Pathways in depdc5 Knockout Zebrafish (A) Swimming activity of 8-dpf larvae treated with muscimol (100 μM), baclofen (100 μM), a combination of both, or vigabatrin (5 mM) with the activity of depdc5+/+ larvae normalized to 100% shows that treatment with vigabatrin can completely rescue hypoactivity, whereas GABA receptor agonists cannot. (B) Vigabatrin treatment completely rescues PTZ hypersensitivity of 2-dpf depdc5−/− embryos. N = 2, n > 30; Student’s t test, ∗p < 0.05. (C) Overlap between gene expression datasets from depdc5, gabra1, tsc2, and scn1a mutants. See also Tables S2 and S4. (D) A representation of the common pathways (axon guidance and GABA synapse) affected in depdc5 and gabra1 knockout brains with the common genes indicated. See also Table S3. |
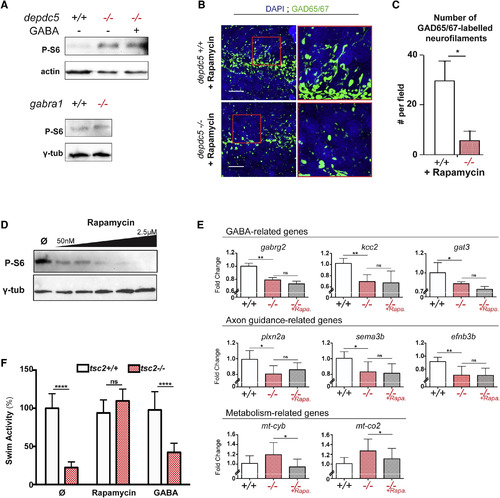
Figure 7. mTOR Deregulation and GABAergic Defects Are Independent Effects of Depdc5 Knockout (A) Western blotting of 7-dpf depdc5+/+ and depdc5−/− larval lysates shows no change in phospho-S6 levels upon GABA treatment (100 μM from 8 hpf; top). Western blotting of 7-dpf gabra1+/+ and gabra1−/− larval lysates shows no difference in mTOR signaling upon knocking out gabra1 (bottom). (B) Images of transverse sections of 7-dpf rapamycin-treated depdc5+/+ and depdc5−/− larvae immunostained with α-GAD65/67 and counterstained with DAPI. Section level is displayed in the schematic drawing. Regions indicated in red boxes have been magnified to show the branching defects. Rapamycin treatment was begun at 8 hpf: 100 nM from day 0 to 2, 300 nM from day 3 onward; n = 3/genotype. Scale bars, 10 μm. (C) Quantification of GAD65/67-positive neurofilaments in rapamycin-treated depdc5+/+ and −/− larval brain sections shows that rapamycin treatment does not rescue the reduced number of filaments in depdc5−/−. (D) Western blotting of 5-dpf larval lysates upon treatment with increasing concentrations of rapamycin (50 nM, 250 nM, 500 nM, 1 μM, and 2.5 μM) from 8 hpf to estimate phospho-S6 levels shows a dose-dependent decrease. Rapamycin-containing water was changed every day. (E) RT-qPCR-based estimation of some down- and upregulated genes involved in axon guidance, GABA synapse activity, and metabolism. ef1a expression was used for normalization; expression of depdc5+/+ was normalized to 1 (∗p < 0.05, ∗∗p < 0.01). (F) Swimming activity of 7-dpf tsc2 larvae treated with rapamycin and GABA (day 0 onward) over 5-min light/10-min dark phases, with the activity oftsc2+/+ larvae normalized to 100%, shows that rapamycin, but not GABA, can rescue the hypoactivity (Student’s t test, ∗∗∗∗p < 0.0001). |