
- Title
-
Overlapping but distinct topology for zebrafish V2R-like olfactory receptors reminiscent of odorant receptor spatial expression zones
- Authors
- Ahuja, G., Reichel, V., Kowatschew, D., Syed, A.S., Kotagiri, A.K., Oka, Y., Weth, F., Korsching, S.I.
- Source
- Full text @ BMC Genomics
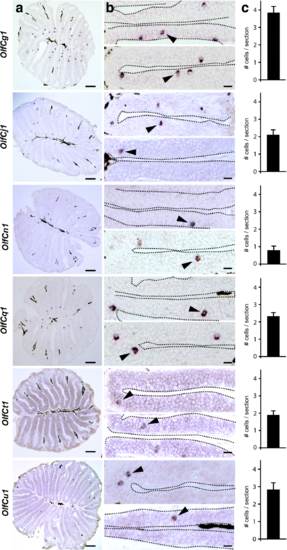
v2r-related OlfC genes generally are expressed in small subsets of scattered olfactory sensory neurons. Horizontal sections of adult zebrafish olfactory epithelium were hybridized with probes for OlfCg1, OlfCn1, OlfCq1, OlfCj1, OlfCu1, and OlfCt1. Column a shows representative complete sections labeled with the respective probes. The scale bars correspond to 40 μm. Column b, higher magnifications from different sections. The hybridization signal was observed in sparse cells within the sensory region of the olfactory epithelium, as expected; arrowheads point to some labeled neurons. The scale bars correspond to 20 μm. c Bar graphs representing number of labeled cells per section for each OlfC gene (mean +/− SEM, n = 78–265 sections/gene) EXPRESSION / LABELING:
|
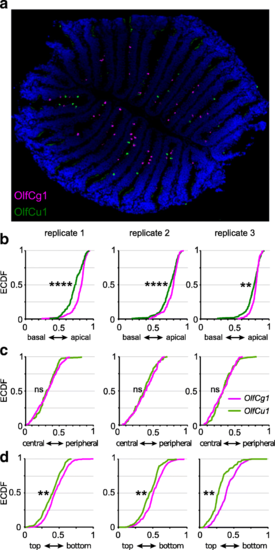
Simultaneous labeling of two OlfC genes confirms distinctly different distributions. a Representative micrograph of two-color in situ hybridization, depicting sparse expression of OlfCg1 (in magenta) and OlfCu1 (in green), within a single horizontal section of the olfactory epithelium. b-d Quantitative assessment of the distributions of the labeled cells for laminar height (b), radial distance (c) and along the vertical z-axis (d). The resulting distributions of relative laminar height (from 0, most basal to 1, most apical, i.e. bordering to the lumen), relative radius (from 0, innermost to 1, outermost) and relative height within the organ (from 0, top section to 1, bottommost section) are shown unbinned as empirical cumulative distribution function (ECDF). Color of ECDF graphs corresponds to the color employed in panel a. KS-test with a p-value cutoff of < 0.01 was used to evaluate the significance of differences between the distributions, if any. Significance is indicated by asterisks, **, p ≤ 0.01; ****, p ≤ 0.0001 EXPRESSION / LABELING:
|
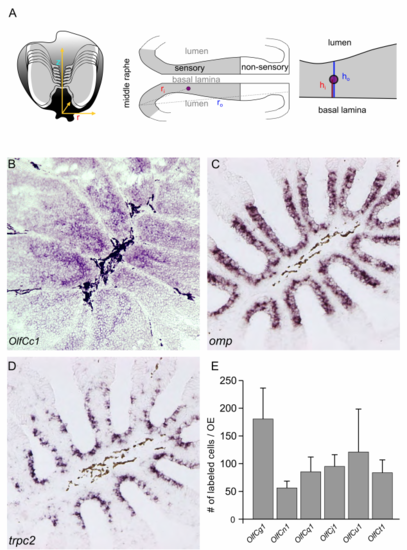
Quantitative in situ hybridisation of OlfC-expressing cells. (A-C) Comparison of OlfCc1 expression with that of olfactory neuron marker genes OMP and TRPC2. Labeled cells were exclusively detected in the sensory region of the adult olfactory epithelium. OlfCc1 distribution is similarly apical as TRPC2 and more apical than OMP, the marker for ciliated neurons. (D) Expression frequency for six different OlfC genes. The bar graphs represent the number of cells observed for a particular OlfC gene in the complete olfactory organ comprising 40–60 sections (mean +/− SEM, n = 3–5 olfactory organs). (PDF 12927 kb) EXPRESSION / LABELING:
|