- Title
-
A novel system to quantify intestinal lipid digestion and transport
- Authors
- Sæle, Ø., Rød, K.E.L., Quinlivan, V.H., Li, S., Farber, S.A.
- Source
- Full text @ Biochim. Biophys. Acta
|
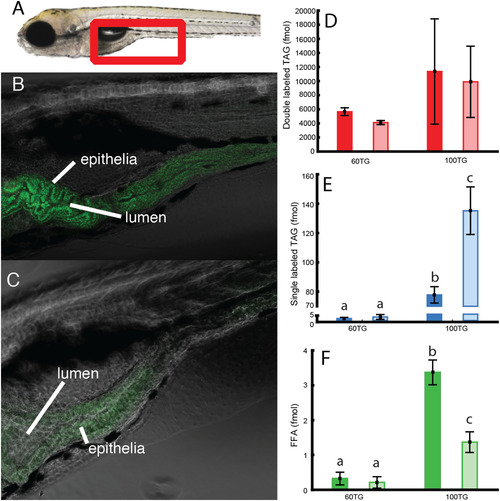
Left panel: anterior intestine of zebrafish larvae (see red frame in A). Larvae in panel B were fed a 100% TG diet and larvae in panel C were fed 60% TG and 40% PC diet. Both diets were labeled with double labeled TG. The pure TG diet is digested and absorbed, but accumulates in intestinal epithelia (B). When PC is added to the diet, products of digested fluorescent TG do not accumulate in intestinal tissue (C). Images are representative of 6 larvae per group. Right panel: D, E and F show quantification by HPLC of labeled lipid per larva after 60 min feeding (dark colored column) and 120 min (light colored columns). |
|
A) Left panel: anterior intestine of zebrafish larvae (see red frame). B) and C) Larvae were fed a diet composed of 60% TG and 40% PC. Both diets contained fluorescent double labeled PC. B) Fluorescence in the intestinal lumen and epithelium is diffuse, indicating strong emulsification. C) Larvae were treated with Orlistat, a drug blocking neutral lipase activity. Emulsification of dietary lipid was inhibited, visualized as strong globular fluorescence in the lumen. Images represent results from 6 larvae per treatment group. D) More double labeled PC is present in zebrafish treated with lipase inhibitors. Red is double labeled and blue (graph in inset) is single labeled PC. |


