- Title
-
Atypical Cadherin Dachsous1b Interacts with Ttc28 and Aurora B to Control Microtubule Dynamics in Embryonic Cleavages
- Authors
- Chen, J., Castelvecchi, G.D., Li-Villarreal, N., Raught, B., Krezel, A.M., McNeill, H., Solnica-Krezel, L.
- Source
- Full text @ Dev. Cell
|
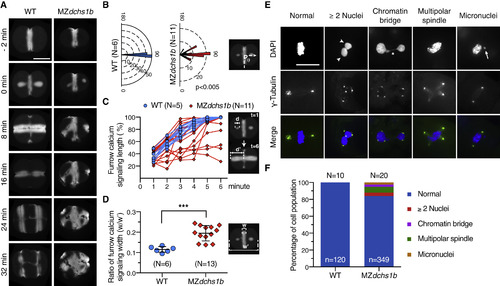
Disrupted Embryonic Cleavages in MZdchs1b (A) Representative time-lapse still images of cleavage furrow calcium signaling indicated by Tg[βactin2:GCaMP6s]stl351 during cleavage stages in WT and MZdchs1b. Scale bar, 300 μm. (B) Quantification of cleavage furrow orientation by monitoring calcium signaling in WT and MZdchs1b at 2–4 cell stage. Directional distributions of the positioning angle θ is shown as a rose diagram of 5° bins. Each bin represents a percentage of the total population with the circular line indicating the percentile. N, number of embryos. p < 0.005, Mardia-Watson-Wheeler test. (C) Quantification of calcium signaling dynamics during furrow propagation in WT and MZdchs1b at 2–4 cell stage. The Y axis shows the percentage of furrow calcium signaling width d at each time point divided by the total cell width d’. N, number of embryos. (D) Quantification of the ratio of the first furrow deepening calcium signaling width at the onset of second cleavage in WT and MZdchs1b. The Y axis shows the ratio of the initial cleavage calcium signaling width w divided by the total cell width w’. N, number of embryos. ∗∗∗p < 0.001, Student's unpaired t test. Error bars represent SD. (E) Representative images of mitotic and cytokinesis events in the blastomeres stained using γ-tubulin (green) antibody and counterstained with DAPI (blue). Scale bar, 30 μm. Arrowheads indicate two or more nuclei in one cell, asterisk indicates abnormal chromatin bridge, and arrow indicates micronuclei. (F) Quantification of mitotic events in WT and MZdchs1b embryos at 2.5 hpf. N, number of embryos. n, number of cells. See also Figure S1, Video S1. |
|
Midzone Microtubule Assembly and YCL Microtubule Dynamics Defects in MZdchs1b (A) Representative time-lapse still images of microtubule dynamics during cytokinesis in WT and MZdchs1b embryos using Tg[ef1α:dclk-GFP]. Arrowheads denote the initial midzone microtubule width. Scale bar, 30 μm. (B) Quantification of the midzone microtubule assembly activities in WT and MZdchs1b. The Y axis shows the ratio of midzone microtubule width d at each time point divided by the initial width d’. N, number of embryos. ∗∗∗∗p < 0.0001, paired Student's two-tailed t test was used to determine the difference between control and mutants across the time course. Error bars represent SEM. (C) Representative still time-lapse images of YCL microtubules marked with Tg[ef1α:dclk-GFP] during cleavage stages in WT and MZdchs1b. To the right a cartoon of eight-celled embryo with the black box illustrating the analyzed region; A, animal pole; V, vegetal pole. Scale bar, 30 μm. (D) Quantification of YCL microtubule density during individual cell cycles from the time-lapse videos in WT and MZdchs1b. N, number of embryos. Error bars represent SEM. (E) Quantification of EB3-GFP track speed in the YCL in WT and MZdchs1b. The Y axis shows the relative frequency of all quantified tracks in corresponding speed bins. The right panel shows a representative speed heatmap in the region of interest. A, animal pole; V, vegetal pole. N, number of embryos; n, number of EB3 tracks. (F) Directional distribution of EB3-GFP track angles in WT and MZdchs1b. N, number of embryos; n, number of EB3 tracks. See also Figure S6, Videos S3 and S4. |
|
Dchs1b Interacts with the N-Terminal TPR Motifs of Ttc28 via its ICD CM2-N Motif (A) RT-PCR assays to compare the expression levels of ttc28 at different developmental stages in zebrafish. gapdh housekeeping gene as a reference control. (B) The expression patterns of ttc28 revealed by whole-mount in situ hybridization at eight-cell stage (1.15 hpf), 4.3 hpf, and 1 dpf zebrafish. ttc28 sense probe was used as a negative control. (C) Co-IP assays of HA-Ttc28 with full-length Dchs1b-sfGFP or membrane GFP. (D) Co-IP assays of Flag-Dchs1b-ICD with HA-Ttc28. (E) Co-IP assays of Flag-Dchs1b-ICD with HA-Ttc28-N, HA-Ttc28-N-1, or HA-Ttc28-ΔN-1. (F) Schematic of Ttc28 truncation constructs and the co-IP results of Ttc28 deletion mapping. (G) Co-IP assays of HA-Ttc28-N with Flag-Dchs1b-ICDΔCM1, Flag-Dchs1b-ICDΔCM2, or Flag-Dchs1b-ICDΔCM3. (H) Co-IP assays of HA-Ttc28-N with Flag-Dchs1b-ICD-N1, Flag-Dchs1b-ICD-N2, or Flag-Dchs1b-ICD-N3. (I) Co-IP assays of HA-Ttc28-N with Flag-Dchs1b-ICD, Flag-Dchs1b-ICDΔCM2-N, or Flag-Dchs1b-ICDΔCM2-C. (J) Schematic of Dchs1b-ICD deletion and truncation constructs and sequence alignment of Dchs CM2 motifs from different species. Disorder consensus bar, intensity of green corresponds with the strength of the consensus disorder agreement among eight prediction algorithms (Oates et al., 2013). Red line, residues of zebrafish Dchs1b involved in Ttc28 interaction. See also Figures S2 and S3. |
|
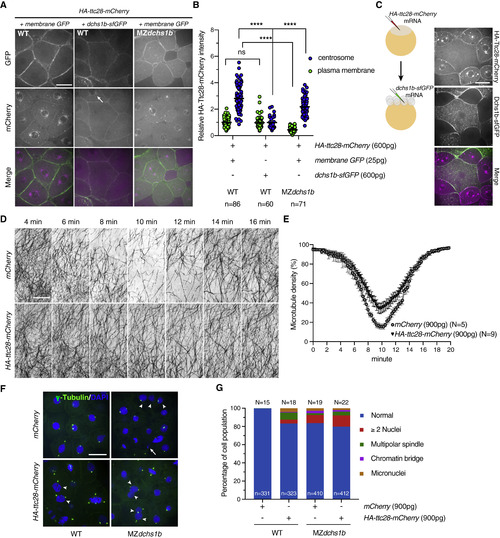
Dchs1b Regulates Ttc28 Subcellular Localization, and Ttc28 Is Sufficient to Influence YCL Microtubule Dynamics and Embryonic Cleavages (A) Representative images showing the subcellular localizations of HA-Ttc28-mCherry (magenta) with membrane GFP (green) or Dchs1b-sfGFP (green) in the WT and MZdchs1b at 3–4 hpf in embryos injected with synthetic RNAs encoding HA-Ttc28-mCherry (600 pg), membrane GFP (25 pg), and Dchs1b-sfGFP (600 pg). The arrow points to a centrosome marked by HA-Ttc28-mCherry accumulation. Scale bar, 30 μm. (B) Quantification of the relative HA-Ttc28-mCherry intensity at the plasma membrane and centrosome normalized to the cytoplasmic signal in the same cell in the various injection conditions. n, number of cells quantified. ns, not significant. ∗∗∗∗p < 0.0001, Tukey's multiple comparisons test. (C) Cartoon of the experimental design and confocal images of mosaic analyses of HA-Ttc28-mCherry and Dchs1b-sfGFP interaction in vivo. HA-ttc28-mCherry RNA was injected at one-cell stage and dchs1b-sfGFP RNA was subsequently injected into one of the blastomeres at eight-cell stage. Confocal imaging was performed at 3–4 hpf. Scale bar, 30 μm. (D) Representative time-lapse still images of YCL microtubules in mCherry and HA-Ttc28-mCherry RNA (900 pg) injected Tg[ef1α:dclk-GFP] WT embryos at 1.75–2.5 hpf. Scale bar, 30 μm. (E) Quantification of YCL microtubule density in mCherry control and HA-Ttc28-mCherry overexpressing embryos at 1.75–2.5 hpf. Error bars represent SEM. N, number of embryos. (F) Representative images of blastomeres stained with γ-tubulin (green) and counterstained with DAPI (blue) in WT and MZdchs1b embryos at 4–5 hpf injected with either mCherry or HA-ttc28-mCherry RNA (900 pg) at one-cell stage. Arrows indicate multiple nuclei, and arrowheads indicate chromatin bridges. Scale bar, 30 μm. (G) Quantification of mitotic events at 4–5 hpf in WT and MZdchs1b blastulae injected with mCherry or HA-ttc28-mCherry RNA (900 pg) at one-cell stage. N, number of embryos; n, number of cells. See also Figures S2 and S4, and Video S5. |
|
Ttc28 Is Required to Regulate Microtubule Dynamics (A) Schematic of ttc28 single guide RNA targeting site and the sequences of ttc28stl362 and ttc28stl363 mutant alleles. Asterisk indicates premature stop codon. (B) qPCR analyses of ttc28 transcript levels in WT, MZttc28stl362/stl362, and MZttc28stl363/stl363 mutants at two-cell stage. Two different sets of primers were used and normalized to β-actin. ∗∗∗∗p < 0.0001, Student’s t test. Error bars represent SD. N = 3 biological repeats. (C) Representative time-lapse still images of YCL microtubules at 1.75–2.5 hpf in WT, MZttc28stl363/stl363, and HA-Ttc28-mCherry RNA-injected (900 pg) MZttc28stl363/stl363Tg[ef1α:dclk-GFP] embryos. Scale bar, 30 μm. (D) Quantification of YCL microtubule density from time-lapse videos in WT, MZttc28stl363/stl363, and HA-Ttc28 or HA-Ttc28-mCherry RNA-injected (900 pg) MZttc28stl363/stl363 embryos at 1.75–2.5 hpf. Error bars represent SEM. N, number of embryos. (E) Representative time-lapse still images of microtubule dynamics during cytokinesis in WT and MZttc28stl363/stl363 embryos using Tg[ef1α:dclk-GFP]. Scale bar, 30 μm. (F) Quantification of midzone microtubule assembly rates in WT and MZttc28stl363/stl363 blastulae at 1.75–2.5 hpf. ∗∗∗∗p < 0.0001, paired Student's two-tailed t test. Error bars represent SEM. N, number of embryos. See also Figures S5 and S6, Videos S6 and S7. |
|
ttc28 Genetically Interacts with dchs1b to Regulate Microtubule Dynamics (A) Representative time-lapse still images of YCL microtubules in MZdchs1b single and MZdchs1b; MZttc28stl363/stl363 compound mutants in Tg[ef1α:dclk-GFP] transgenic background at 1.75–2.5 hpf. Scale bar, 30 μm. (B) Quantification and comparison of YCL microtubule density in WT, MZdchs1b single, and MZdchs1b; MZttc28stl363/stl363 compound mutant at 1.75–2.5 hpf. Error bars represent SEM. N, number of embryos. (C) Representative time-lapse still images of microtubule dynamics during cytokinesis in MZdchs1b single and MZdchs1b; MZttc28stl363/stl363 compound mutant embryos using Tg[ef1α:dclk-GFP]. Scale bar, 30 μm. (D) Quantification of midzone microtubule assembly rates in WT, MZdchs1b single, and MZdchs1b; MZttc28stl363/stl363 compound mutant blastulae at 1.75–2.5 hpf. The Y axis shows the ratio of midzone microtubule width d at each time point divided by the initial width d’. ∗∗∗∗p < 0.0001, paired Student's two-tailed t test. Error bars represent SEM. N, number of embryos. (E) Comparison of mitotic events in WT, MZdchs1b single, and MZdchs1b; MZttc28stl363/stl363 compound mutant embryos at 3 hpf. N, number of embryos; n, number of cells. See also Video S8. |
|
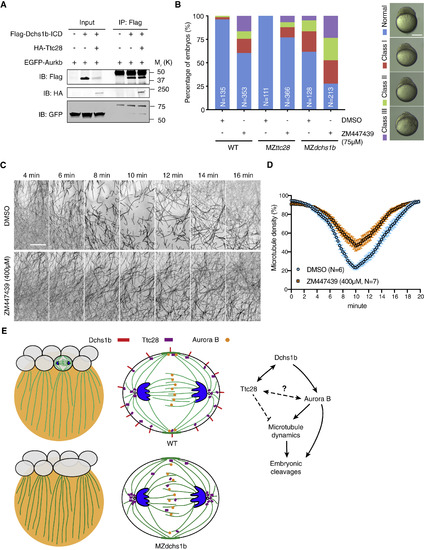
Functional Interactions between Dchs1b, Ttc28, and Aurora B in Embryonic Cleavages (A) Co-IP assays of Flag-Dchs1b-ICD with EGFP-Aurkb and HA-Ttc28. IB, immunoblotting; IP, immunoprecipitation. (B) Quantification of cleavage defects in WT, MZttc28stl363/stl363, and MZdchs1b embryos at 3–3.5 hpf following DMSO control or 75 μM ZM447439 treatment. The right panel shows the representative severity of cleavage defects. N, number of embryos. (C) Representative time-lapse still images of YCL microtubules in Tg[ef1α:dclk-GFP] transgenic WT embryos after DMSO or 400 μM ZM447439 treatment. Scale bar, 30 μm. (D) Quantification of YCL microtubule density in DMSO control and ZM447439 (400 μM)-treated embryos. Error bars represent SEM. N, number of embryos. (E) Models of Dchs1b interacting with Ttc28 and Aurora B to control microtubule dynamics and embryonic cleavages in zebrafish blastomeres of WT and MZdchs1b mutant embryos. Dchs1b, Ttc28, and Aurora B during cleavages. Dchs1b binds to Ttc28 at the membrane to limit its microtubule dynamics reducing activity in the cytoplasm. Potential direct or indirect effects of Ttc28 on Aurora B are also illustrated. Binding of Dchs1b to Aurora B promotes its activity stimulating microtubule dynamics. Aurora B has additional effects on early cleavages. See also Video S2. |
Reprinted from Developmental Cell, 45, Chen, J., Castelvecchi, G.D., Li-Villarreal, N., Raught, B., Krezel, A.M., McNeill, H., Solnica-Krezel, L., Atypical Cadherin Dachsous1b Interacts with Ttc28 and Aurora B to Control Microtubule Dynamics in Embryonic Cleavages, 376-391.e5, Copyright (2018) with permission from Elsevier. Full text @ Dev. Cell


