
- Title
-
let-7 MicroRNA-Mediated Regulation of Shh Signaling and the Gene Regulatory Network Is Essential for Retina Regeneration
- Authors
- Kaur, S., Gupta, S., Chaudhary, M., Khursheed, M.A., Mitra, S., Kurup, A.J., Ramachandran, R.
- Source
- Full text @ Cell Rep.
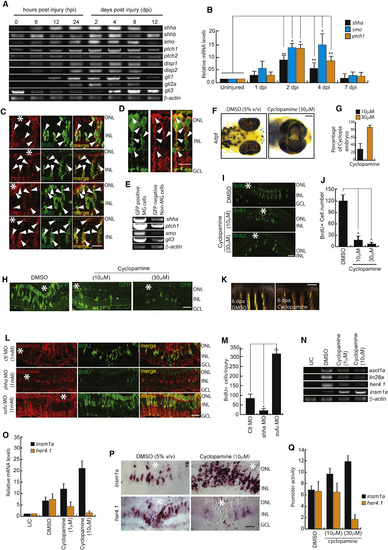
Shh Signaling Is Necessary for MG Dedifferentiation in the Injured Retina (A and B) RT-PCR (A) and qPCR (B) analysis of Shh signaling component genes in the retina at indicated time points post-injury; n = 6 biological replicates. ∗p < 0.001; ∗∗p < 0.003. (C and D) Immunofluorescence (IF) microscopy images of Shh signaling components in wild-type BrdU+ MGPCs (C), and Shh expression in 1016 tuba1a:GFP transgenic fish at 4 dpi (D). Arrowheads mark protein expression in cells in (C) and (D). (E) RT-PCR assay of Shh signaling component genes in GFP-positive MGPCs and the rest of the cells from 1016 tuba1a:GFP transgenic retina at 4 dpi. (F and G) Bright-field (BF) images of 4-days post-fertilized embryos treated with 5% (v/v) DMSO and 30 μM cyclopamine (F), and quantification of the number of cyclopia embryos (G). (H–J) IF microscopy images showing a dose-dependent decline in GFP+ and BrdU+ MGPCs in 1016 tuba1a:GFP transgenic (H) and wild-type (I) retinae, respectively, at 4 dpi upon cyclopamine treatment, which is quantified in (J). (K) BF microscopy images of blastema during caudal fin regeneration in cyclopamine-treated wild-type zebrafish at 6 days post-amputation. (L and M) IF microscopy images of retinal sections with shha or sufu knockdowns (L), and quantification of the number of BrdU+ cells at the injury site (M). ∗p < 0.0001; n = 4 biological replicates. Lissamine tag on MO shows red fluorescence in (L). (N–P) RT-PCR analysis of ascl1a, lin28a, her4.1, and insm1a in uninjured control, 2.5 dpi DMSO-treated, and 2.5 dpi cyclopamine-treated retina (N); qPCR analysis of mRNA levels of insm1a and her4.1 with cyclopamine treatment (O); and BF images of corresponding mRNA in situ hybridization (ISH) of these genes in the retina at 4 dpi (P). (Q) Single-cell-stage embryos were injected with insm1a:luciferase or her4.1:luciferase vectors along with Renilla luciferase mRNA for normalization and then treated with cyclopamine for 24 hr before lysing for quantification of insm1a and her4.1 promoter activity using a dual luciferase assay. Scale bars represent 10 μm in (C), (D), (H), (I), (L), and (P) and 500 μm in (F) and (K). Asterisk indicates the injury site (C, H, I, L, and P). Error bars represent SD. ∗p < 0.0001 (J); ∗p < 0.001 (M). n = 6 biological replicates. GCL, ganglion cell layer; INL, inner nuclear layer; ONL, outer nuclear layer; UC, uninjured control. See also Figures S1, S2, S6, and S7. |
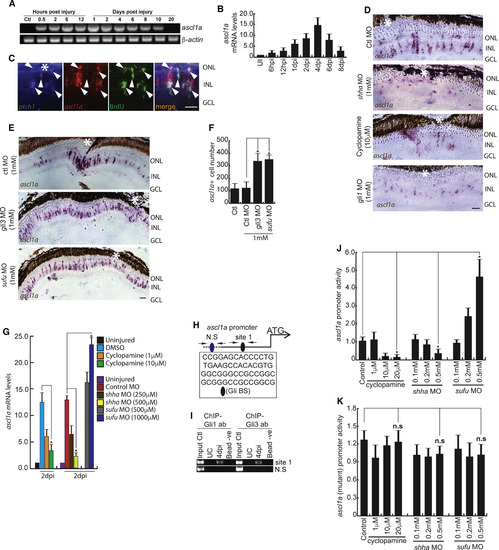
Shh-Signaling-Dependent ascl1a Regulation in the Injured Retina (A and B) RT-PCR (A) and qPCR (B) analysis of ascl1a in the post-injured retina; n = 6 biological replicates. (C) Fluorescence ISH (FISH) and IF microscopy images of a 0.5-μm-thick optical section of retina showing co-localization of ascl1a with ptch1 in BrdU+ MGPCs at 4 dpi. Arrowheads mark co-expression of genes in BrdU+ cells. (D–F) BF microscopy images of ascl1a mRNA ISH in retina at 4 dpi with cyclopamine treatment, shha or gli1 knockdowns (D), and gli3 or sufu knockdowns (E). The number of ascl1a+ cells from (E) is quantified in (F). (G) qPCR analysis of ascl1a mRNA with cyclopamine treatment and shha or sufu knockdown in 2 dpi retina. (H) Schematic of the ascl1a promoter with a putative Gli-binding site (Gli-BS) cluster. Arrows mark ChIP primers, N.S marks the negative control, and capital letters mark putative Gli-BSs. (I) Retinal ChIP assay at 4 dpi showing both Gli1 and Gli3 bound to the ascl1a promoter. (J) Luciferase assay in 24 hpf embryos co-injected with ascl1a:GFP-luciferase vector and sufu or shha MOs. (K) Luciferase assay was done with mutated Gli-BS of ascl1a promoter in an experiment similar to (J). Scale bars represent 10 μm in (C) and 20 μm in (D) and (E). Asterisk indicates the injury site (C–E). Error bars represent SD. ∗p < 0.0001 (F); ∗p < 0.01 (G); ∗p < 0.01 (J). n = 6 biological replicates (F and G); n = 3 (J). See also Figures S2, S6, and S7. |
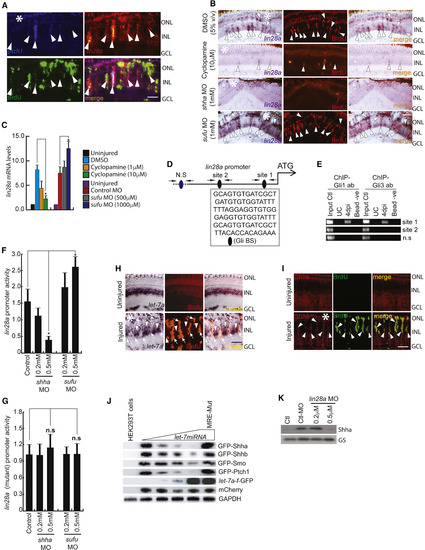
Lin28a-let-7 Axis Regulates Shh Signaling Component Genes in the Injured Retina (A) FISH and IF microscopy images of a 0.5-μm-thick optical section of retina showed co-localization of lin28a with ptch1 in BrdU+ MGPCs at 4 dpi. Arrowheads mark co-expression of genes in BrdU+ cells. (B and C) BF microscopy images of lin28a mRNA ISH in the retina at 4 dpi with cyclopamine treatment and shha or sufu knockdown (B), which was quantified by qPCR (C). Arrowheads mark co-expression of genes in BrdU+ cells in (B). (D and E) Schematic of the lin28a promoter with a potential Gli-BS cluster, where arrows mark ChIP primers and capital letters mark consensus sequence of Gli-BS (D). A 4 dpi retinal ChIP assay showed both Gli1 and Gli3 bound to one of the two Gli-BS clusters (E). (F) Luciferase assay in 24 hpf embryos co-injected with lin28a:GFP-luciferase vector and sufu or shha MOs. (G) Luciferase assay with mutated Gli-BSs of the lin28a promoter in an experiment similar to (F). (H and I) ISH and IF microscopy of retina showing co-exclusion of let-7a microRNA (H) and co-localization of Shha protein (I) in BrdU+ MGPCs in the retina at 4 dpi. Arrowheads mark expression of let-7a in BrdU− cells and arrows mark co-exclusion of let-7a from BrdU+ cells in (H). Arrowheads mark co-expression of Shha in BrdU+ cells in (I). (J) let-7 microRNA downregulated the translation of GFP fused with the indicated gene constructs harboring microRNA-binding regions in a dose-dependent manner in HEK293T cells. (K) Western blot of Shha in lin28a-MO electroporated retina at 4 dpi. Scale bars represent 10 μm (A, H, and I) and 20 μm (B). Asterisk indicates the injury site (A, B, H, and I). Error bars represent SD.∗p < 0.001 (C); ∗p < 0.001 (F). n = 6 biological replicates (C, F, and G). GS, glutamine synthetase. See also Figures S3, S6, and S7. |

Shh-Mmp9-Ascl1a Interplay Is Necessary during MG Reprogramming (A) RT-PCR (top) and qPCR (bottom) analysis of injury-dependent mmp9 expression in the retina; n = 6 biological replicates. (B–D) BF microscopy images of mmp9 mRNA ISH in the retina at 4 dpi with cyclopamine treatment and shha or sufu knockdown (B), as quantified by qPCR (C), and a luciferase assay in 24 hpf embryos injected with mmp9:GFP-luciferase vector (D). (E–G) IF microscopy images of 4 dpi retina with Mmp9 blockade using drugs (E) and MO against mmp9 (F). The number of BrdU+ MGPCs is quantified in (G). (H) FISH and IF microscopy images of a 0.5-μm-thick optical section of retina showing co-localization of mmp9 and ascl1a in BrdU+ MGPCs at 4 dpi. Arrowheads mark co-expression of genes in BrdU+ cells. (I) BF microscopy images of ascl1a and mmp9 mRNA ISH in ascl1a and mmp9 knockdowns in 4 dpi retina. (J) Western blotting experiment showing Shh levels in 2 dpi retina with the mmp9 knockdown. (K) Western blotting assay of Ascl1a in 2 dpi retina with shha or sufu knockdowns. (L) Western blotting assay of Ascl1a in 2 dpi zebrafish retina injected with recombinant SHH protein. (M) Western blotting assay of ASCL1 in 6 dpi mouse retina injected with recombinant SHH protein. (N) Western blotting assay of Shha in DAPT-treated retina at 1dpi. (O and P) RT-PCR (top) and qPCR (bottom) analysis of ascl1a and mmp9 in DAPT-treated retina, with or without ascl1a or mmp9 knockdown (O), and confirmed by western blotting assay (P). (Q) FISH and IF microscopy images of a 0.5-μm-thick optical section of retina showed substantial co-exclusion and marginal co-localization of mmp9 with her4.1 at 4 dpi. Arrowheads mark co-expression of the gene, and arrows mark her4.1+ cells. (R and S) Schematic of the mmp9 promoter with potential Hes/Her-BS binding sites (inside box), and luciferase assay in 24 hpf embryos co-injected with mmp9:GFP-luciferase construct and notch intracellular domain (nicd) mRNA (S). Scale bars represent 10 μm (H and Q) and 20 μm (B, E, F, and I). Asterisk indicates the injury site (B, E, F, H, I and Q). Error bars represent SD. ∗p < 0.001 (C, D, G, and S). Biological replicates n = 6 in (C) and (G), and n = 3 in (D) and (S). See also Figures S3, S4, S6, and S7. |
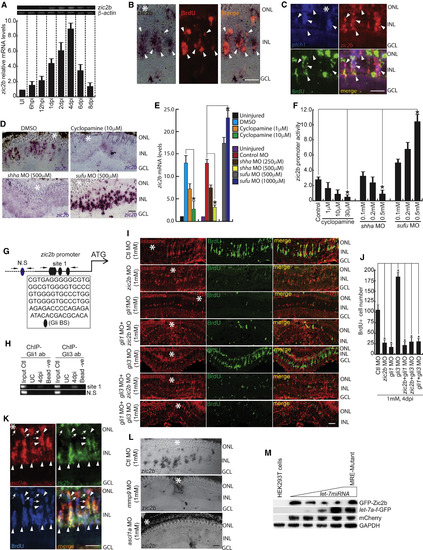
The Shh-Mediated Zic2b Axis Is Necessary during Retina Regeneration (A) RT-PCR (top) and qPCR (bottom) analysis of injury-dependent zic2b expression in the retina; n = 6 biological replicates. (B) ISH and IF microscopy revealed co-localization of zic2b mRNA with BrdU+ MGPCs in 4 dpi retina. (C) FISH and IF microscopy images of a 0.5-μm-thick optical section of retina showing co-localization of zic2b with ptch1 in BrdU+ MGPCs at 4 dpi. (D and E) BF microscopy images of zic2b mRNA ISH in 4 dpi retina, with cyclopamine treatment, MO mediated shha or sufu knockdown done separately (D), which is quantified in (E). (F) Luciferase assay in 24 hpf embryos injected with zic2b:GFP-luciferase vector with cyclopamine treatment and shha or sufu knockdowns. (G) Schematic of the zic2b promoter with a putative Gli-BS. Arrows mark ChIP primers, N.S marks negative control devoid of Gli-BSs, and capital letters mark consensus of Gli-BSs. (H) Retinal ChIP assay at 4 dpi showing both Gli1 and Gli3 bound to the zic2b promoter. (I) IF microscopy images of BrdU+ cells in the regenerating retina with zic2b, gli1, and gli3 knockdowns in isolation or combination, delivered at the time of injury, compared with control MO. (J) BrdU+ cells are quantified in the indicated knockdowns. (K) FISH and IF microscopy images of a 0.5-μm-thick optical section of retina showing co-localization of zic2b with ascl1a in BrdU+ MGPCs at 4 dpi. Arrowheads indicate ascl1a and zic2b co-expression, whereas arrows indicate ascl1a+ but zic2b− cells. (L) ISH microscopy retinal images of zic2b mRNA with mmp9 or ascl1a knockdown at 4 dpi. (M) let-7 microRNA downregulated translation of the GFP construct appended with zic2b harboring microRNA responsive regions in a dose-dependent manner in HEK293T cells. Scale bars represent 10 μm (B, C, and K) and 20 μm (D, I, and L). Asterisk indicates the injury site (B, C, D, I, K, and L). Error bars represent SD. ∗p < 0.001 (E, F, and J). n = 6 biological replicates (E and J); n = 3 (F). See also Figures S4–S7. |
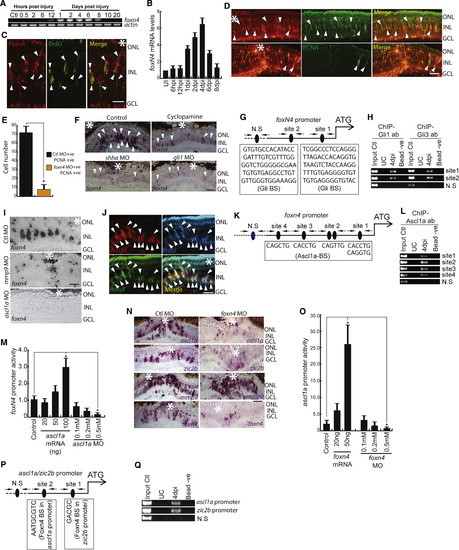
Expression Dynamics and Necessity of Foxn4 during Regeneration (A and B) RT-PCR (A) and qPCR (B) analysis of injury-dependent foxn4 expression in the retina; n = 6 biological replicates. (C) IF microscopy of a 0.5-μm-thick optical section of retina revealing co-localization of Foxn4 with BrdU+ MGPCs in 4 dpi retina. (D and E) IF microscopy images of the retina with foxn4 knockdown at 4 dpi (D). The number of PCNA+ MGPCs is quantified in (E). (F) BF microscopy images of foxn4 mRNA ISH in retinal sections with cyclopamine treatment and shha or gli1 knockdowns. (G and H) Schematic of foxn4 promoter with a putative Gli-BS cluster, where arrows mark ChIP primers, N.S marks negative control, and capital letters mark putative Gli-BSs (G). A retinal ChIP assay at 4 dpi showing both Gli1 and Gli3 bound to the foxn4 promoter (H). (I) BF microscopy images of foxn4 mRNA ISH in retinal sections with mmp9 or ascl1a knockdowns. (J) FISH and IF microscopy images of a 0.5-μm-thick optical section of retina showing co-localization of foxn4 and ascl1a in BrdU+ MGPCs at 4 dpi. Arrowheads mark co-expression of genes in BrdU+ cells. (K and L) Schematic of the foxn4 promoter with a putative Ascl1a-binding site cluster, where arrows mark ChIP primers, N.S marks negative control, and capital letters mark putative Ascl1a-BS (K). A retinal ChIP assay at 4 dpi showing Ascl1a bound to the foxn4 promoter (L). (M) Luciferase assay showing foxn4 promoter activity with overexpression or knockdown of ascl1a in 24 hpf embryos. (N) BF microscopy images of mRNA ISH in retinal sections with foxn4 knockdown showing levels of genes (namely, ascl1a, zic2b, mmp9, and foxn4) at 4 dpi. (O) Luciferase assay showing ascl1a promoter activity with overexpression or knockdown of foxn4 in 24 hpf embryos. (P and Q) Schematic of ascl1a and zic2b promoter with a putative Foxn4-binding site cluster, where arrows mark ChIP primers, N.S marks negative control, and capital letters mark putative Foxn4-BS (P). A retinal ChIP assay at 4 dpi showing Foxn4 bound to both the ascl1a and zic2b promoters (Q). Scale bars represent 10 μm (C, D, F, I, J, and N). Error bars represent SD. ∗p < 0.001 (M); ∗p < 0.04 (O). Biological replicates n = 6 in (M) and O, and n = 3 in (B). Asterisk marks injury spots in (C),(D),(F), (J) and (N). See also Figures S5–S7. |
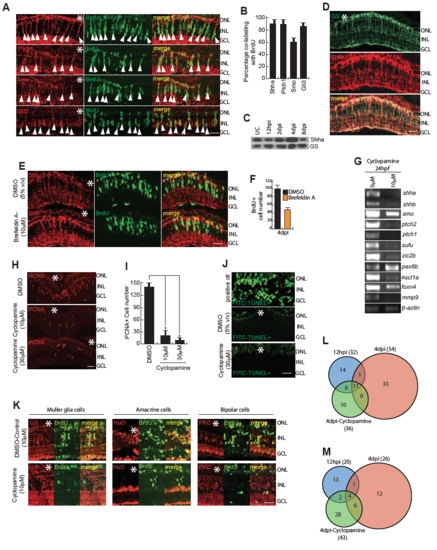
Shh signaling mediated gene expression and lineage tracing of MGPCs in cyclopamine treatment. (A,B) High magnification immunofluorescence microscopy (IF) images of 4dpi retinal sections showed co-localization of Shh signaling components with BrdU+ MGPCs (A), which is quantified in (B). (C) Western blotting assay showed regulation of Shha protein following injury at various time points. (D) IF microscopy images of wild type 4dpi retinal sections revealed significant co-localization of Shha with Glutamine Synthetase (GS), which marks all the Muller glia, at the injury site. (E) IF microscopy of Shha in BrdU+ MGPCs, in 4dpi retina, with Brefeldin A treatment, which is a protein transport inhibitor. (F) BrdU+ cells were quantified in Brefeldin A treatment. (G) RT-PCR analysis of indicated genes mRNA levels in DMSO and cyclopamine treated 24hpf embryos. (H,I) IF microscopy images showed a cyclopamine dose-dependent decline in PCNA+ MGPCs wild-type (H), retinae at 4 dpi, which is quantified in (I) (J) Terminal deoxynucleotidyl transferase (TdT) dUTP Nick-End Labeling (TUNEL) assay done on DNase treated positive control, 4dpi and cyclopamine treated 4dpi retinal sections, showed presence of TUNEL+ cells only in positive control. (K) Cell-fate tracing experiment was done by injuring the fish followed by treating them with 5% (v/v) DMSO or 10μM cyclopamine for first four days followed by an i.p injection of BrdU and then were transferred to water for next 26 days until euthanasia. IF microscopy images of 30dpi retinal sections revealed co-localization of GS, which marks Muller glia, HuD which marks amacrine cells and PKC which marks horizontal cells, with BrdU+ cells in DMSO treated retina but not in cyclopamine treated retina. (L,M) Whole retina RNAseq analysis of DNA binding proteins and transcription factors at 12hpi, 4dpi and 4dpi cyclopamine treatment were compared with uninjured retina showed upregulated genes (L), and downregulated genes (M). Scale bars, 10 μm (A,E,H,J and K) and 20 μm (D). Error bars are SD. |
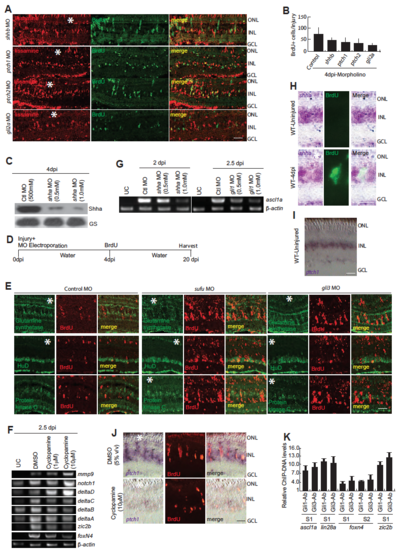
Shh signaling component genes’ knockdowns and lineage tracing of MGPCs in enhanced Shh signaling. (A,B) IF microscopy images of 4dpi retina revealed decline in proliferation marked by reduction in BrdU+ cells in shhb, ptch1, ptch2 and gli2a knockdowns (A), which was quantified in (B). (C) Western blotting assay indicating shha knockdown caused downregulation in the expression of Shha protein. (D,E) The schematic of lineage tracing experiment, wherein control, sufu or gli3 MOs were injected and electroporated while injuring the retina, and an i.p. injection of BrdU was given on 4dpi and eyes were harvested at 20dpi (D), the increased number of BrdU+ cells could make retinal cell types (E). (F) RT-PCR analysis of indicated genes’ mRNA levels in DMSO and cyclopamine treated 2.5dpi retina. (G) RT-PCR analysis of ascl1a mRNA levels in uninjured retina, control knockdown and gli1 knockdown in 2.5dpi retina (H) Bright field (BF) and IF microscopy revealed the expression of shha mRNA and BrdU in uninjured and 4dpi retina. (I,J) ISH and IF of ptch1 and BrdU respectively, in uninjured (I), 4dpi and 4dpi with cyclopamine treatment (J). (K) Relative abundance of ChIP DNA fragments obtained from Gli1 and Gli3 antibodies from various gene promoters, assayed by qPCR, which are normalized to control uninjured retina. Scale bars, 10 μm (A,E,H,I,J). Error bars are SD. |
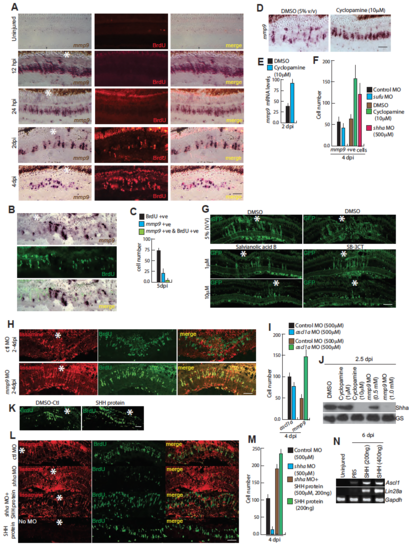
mmp9 expression pattern and impact of SHH protein injection in regenerating retina. (A-C) BF and IF microscopy images of mmp9 and BrdU+ cells at various time points post injury (A), and BrdU co-labeling with mmp9 at 5dpi (B), quantified in (C). (D,E) ISH microscopy revealed increased mmp9 expression in 4dpi retina with cyclopamine treatment (D), mRNA levels quantified in (E). (F) Quantification of mmp9+ cells in 5% (v/v) DMSO control, 10μM cyclopamine treatment and shha or sufu knockdowns in 4dpi retina. (G) IF microscopy images show Salvianolic acid B and SB-3CT dependent decline in GFP+ MGPCs in 1016 tuba:GFP transgenic zebrafish at 4dpi. (H) MOs against control and mmp9 were injected and electroporated at 2dpi, then an i.p. injection of BrdU was given on 4dpi, 3 hours before euthanasia, and no change in the number of BrdU+ cells was found in both knockdowns. (I) Quantification of ascl1a+ and mmp9+ cells in control and ascl1a knockdown retina at 4dpi. (J) Western blotting assay indicating cyclopamine or mmp9 knockdown in 2.5dpi retina caused decline in Shha expression levels. (K) Zone of BrdU+ cells in the regenerating retina, increased upon injection of recombinant Shha protein (200ng) at 4dpi. 0(L,M) IF microscopy images revealed an increase in BrdU+ cell number in combined injection of recombinant SHH protein and shha MO, and isolated injection of SHH protein (200ng) in 4dpi retina, whereas BrdU+ cells declined in shha knockdown (L), which is quantified in (M), suggesting external SHH could impact retina regeneration even in absence of endogenous Shh protein. (N) RT-PCR analysis of Ascl1 and Lin28a genes in 6dpi mouse retina exposed to recombinant SHH protein at the time of injury until harvest. Scale bars, 10 μm (A,B,G,H,K,L). Error bars are SD. |
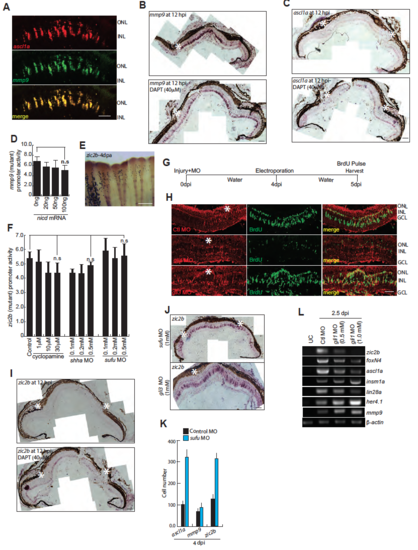
Impact of DAPT treatment or gli1/gli3 knockdowns in gene expression pattern and cell proliferation. (A) FISH microscopy of ascl1a and mmp9 in 4dpi retinal sections. (B-C) Low magnification BF microscopy images of mRNA in situ hybridization of mmp9 (B) and ascl1a (C), in DAPT treated retina at 12hpi, showed an increase in its expression as compared with control. (D) Mutated Her/Hes binding sites abolished the impact of nicd over expression on mmp9 promoter, in zebrafish embryo luciferase assay. (E) BF image of mRNA in situ hybridization of zic2b in 4 days post amputated zebrafish fin. (F) Luciferase assay showed that mutations to the Gli-BS abolished the impact of Shh signaling in zic2b promoter. (G) Schematic describing experimental regime of MO injection at the time of injury and electroporation at 4dpi, followed by an i.p. injection of BrdU at 5dpi before euthanasia. (H) IF microscopy images revealed decrease and an increase in BrdU+ cells in gli1 and gli3 knockdowns respectively. (I) Low magnification BF microscopy images of mRNA in situ hybridization of zic2b in DAPT treated retina, at 12hpi. (J) BF images of mRNA in situ hybridization of zic2b in sufu or gli3 knockdown in 4dpi retina. (K) Quantification of ascl1a+, mmp9+ and zic2b+ cells in control and sufu knockdown. (L) RT-PCR analysis of indicated genes’ mRNA levels in uninjured retina, control and gli1 knockdown retina in 2.5dpi. Scale bars, 10 μm (A,B,C,H,I,J) and 500 μm (E). Error bars are SD. |
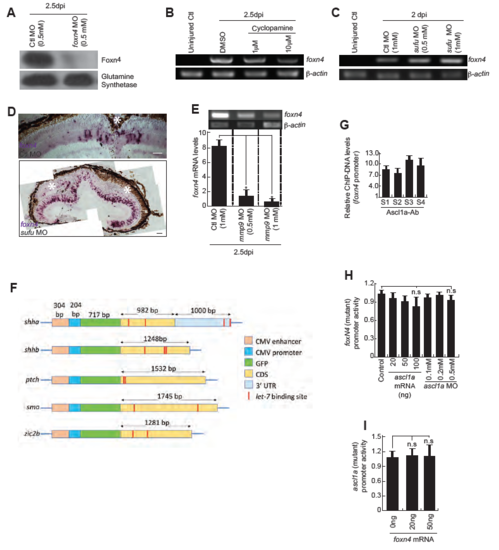
Expression of foxn4 in retina at various conditions (A) Western blot analysis of Foxn4 in foxn4-MO electroporated retina, at 2.5dpi. (B) RT-PCR analysis of foxn4 in uninjured control, 2.5dpi DMSO-treated, and 2.5dpi cyclopamine-treated whole retina. (C) RT-PCR analysis of foxn4 from sufu MOelectroporated retina compared with control MO, at 2dpi. (D) BF microscopy images of foxn4 mRNA ISH in retinal sections electroporated with control and sufu MOs at 4dpi. (E) RT-PCR (upper) and qPCR (lower) analysis of foxn4 in control MO, and mmp9 MO electroporated in 2.5dpi retina. *P<0.001 in E, and error bars are SD. (F) Schematic representation of DNA constructs used in transfection experiments for examining the impact of let-7 microRNA on various genes. (G)qPCR assay revealed the relative abundance of ChIP DNA fragments of foxn4 promoter obtained by Ascl1a antibody which are normalized to control uninjured retina. (H) Luciferase assay revealed that mutated Ascl1a-BS on foxn4 promoter had little effect on positive or negative regulation by ascl1a mRNA or MO respectively. (I) Luciferase assay revealed that mutated Foxn4-BS on ascl1a promoter had little effect on positive regulation by foxn4 mRNA. Scale bars, 10 μm (D). |
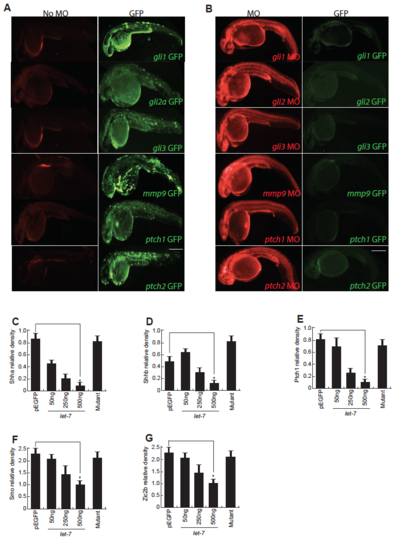
MO assay in embryos. (A,B) The fusion mRNA, prepared by in vitro transcription using the clone containing GFP coding sequence in pCS2+ plasmid appended with the morpholino binding region of the respective genes, was injected alone (A), and along with morpholinos (B) in zebrafish embryos at single cell stage and imaged for GFP and lissamine fluorescence in a fluorescence microscope, at 24hpf. (C-G) Densitometry plots showing the expression of various GFP fusion proteins in let-7 micro RNA dependent manner in HEK293T cells, normalized to transfection control mCherry. *P<0.0001. Scale bars, 500 μm (A,B). |