
- Title
-
Segmentation of the zebrafish axial skeleton relies on notochord sheath cells and not on the segmentation clock
- Authors
- LLeras Forero, L., Narayanan, R., Huitema, L.F.A., VanBergen, M., Apschner, A., Peterson-Maduro, J., Logister, I., Valentin, G., Morelli, L.G., Oates, A., Schulte-Merker, S.
- Source
- Full text @ Elife
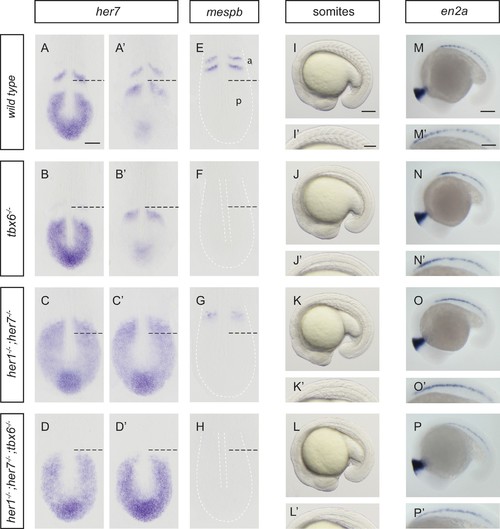
Disruption of the segmentation clock in tbx6, her1;her7 and her1;her7;tbx6 mutants. (A–D’) In situ hybridization for segmentation clock marker her7. (B and B') her7 oscillates in the posterior PSM of tbx6−/−, but does not oscillate in her1−/−;her7−/− (C and C´) or her1−/−;her7−/−;tbx6−/− (D and D`). (E–H) In situ hybridization for segmental output marker mespb. mespb is not expressed in tbx6−/− (F) or her1−/−;her7−/−;tbx6−/− (H), but is weakly expressed in her1−/−;her7−/−, albeit not in segmental stripes (G). (I–L’) Somite boundaries in the paraxial mesoderm. In tbx6−/− (J), her1−/−;her7−/− (K) and her1−/−;her7−/−;tbx6−/− (L) mutants, boundaries lose periodic order. (M–P’) Spatial distribution of muscle pioneers marked by in situ hybridization with en2a. In tbx6−/− (N), her1−/−;her7−/− (O) and her1−/−;her7−/−;tbx6−/− (P) muscle pioneers lose segmental pattern. A-H’ are dorsal views of 13.5 hpf (10 somites) embryos, I-P' are lateral views of 18–19.5 hpf (18–20 somites) embryos. a – anterior, p – posterior. Scale bar in A is 100 µm and applies to A-G. Scale bar in I is 150 µm, applies to I-L and in I’ is 100 µm, applies to I’-L’. Scale bars in M and M’ are 150 µm and 100 µm respectively, and apply to M-P and M’-P’ respectively. EXPRESSION / LABELING:
PHENOTYPE:
|
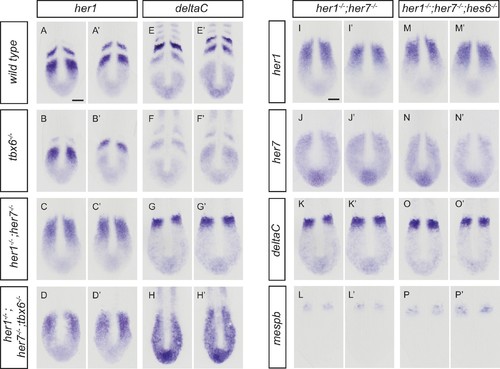
Disruption of the segmentation clock in tbx6, her1;her7, her1;her7;tbx6 and her1;her7;hes6 mutants. (A-H') In situ hybridization for segmentation clock markers her1 and deltaC in tbx6−/−, her1−/−;her7−/−and her1−/−;her7−/−;tbx6−/−. her1 (B and B’) and deltaC (F and F’) oscillate in the posterior PSM of tbx6−/−. her1 (C and C’) and deltaC (G and G’) do not oscillate in her1−/−;her7−/−. (D and D’, H and H’) her1 and deltaC do not oscillate and their expression is restricted to the posterior PSM in her1−/−;her7−/−;tbx6−/−. (I-P') Comparison of clock markers her1, her7 and deltaC and segmental output marker mespb between her1−/−;her7−/− and her1−/−;her7−/−;hes6−/−. her1, her7 and deltaC expression domains are indistinguishable in her1−/−;her7−/− (I and I’, J and J’, K and K’) and her1−/−;her7−/−;hes6−/− (M and M’, N and N’, O and O’). mespb expression in the anterior PSM is equivalently disordered in both mutants (L and L’, P and P’). Embryos are 13.5 hpf (10-somite stage). Scale bar in A applies to A-H’. Scale bar in I applies to I-P’. Scale bars are 100 µm. |
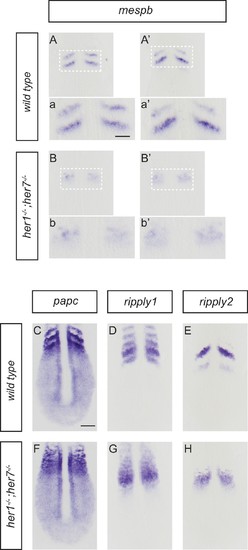
Disruption of segmental output in the anterior PSM of her1;her7 mutants. In situ hybridization for segmentation clock output markers. (A-b') Two examples of mespb expression in the anterior PSM of wild type embryos, present as segmental stripes (A, a and A’, a’) whereas mespb expression is diffuse and lacking segmental organization in her1−/−;her7−/− (B, b and B’, b’). (C-H) Comparison of segmental markers paraxial protocadherin (papc), ripply1 and ripply2 between wild type and her1−/−;her7−/− embryos. papc (C) ripply1 (D) and ripply2 (E) are expressed as stripes in the anterior PSM and ripply1 is also expressed in the posterior compartment of the formed somites in wild type, but all markers show disrupted segmental organization in her1−/−;her7−/− (F, G and H respectively). A - H are dorsal views of 13.5 hpf (10 somites) flat-mounted embryos. Scale bar in C is 100 µm and applies to A - H. Scale bar in a is 50 µm and applies to insets a, a’, b and b’. |
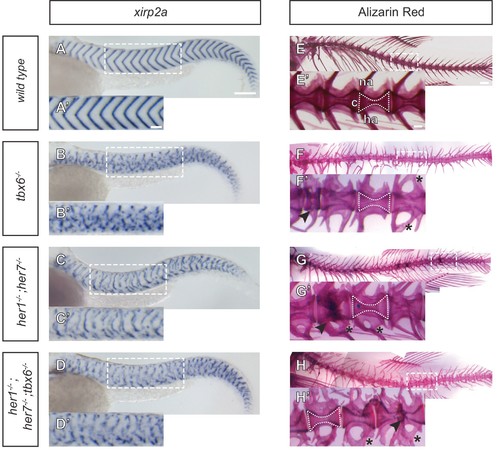
Myotome boundaries are disrupted in segmentation clock mutants, but chordacentra are still patterned. (A to D’) In situ hybridization for myotome boundary marker xirp2a. Myotome boundaries are disrupted to differing degrees of severity depending on the genotype. (E–H’) Alizarin Red bone preparations. Centra are well-formed in tbx6−/− (n = 10) (F), while neural and hemal arches are often fused (F´). Centra are also well-formed in her1−/−;her7−/− (n = 14) (G,G’) and her1−/−;her7−/−;tbx6−/− (n = 15) (H,H’). Occasional defects occur, seen as smaller vertebrae (arrowhead in F’), or as fusions of two vertebrae (arrowheads in G’ and H’). Larvae in A-D are 40 hpf. Adult fish in E-H are between two and six months. All animals in lateral view with anterior to the left. na - neural arch, hr - hemal arch, c - centrum. Scale bars in A and A’ are 150 µm and 100 µm respectively and apply to A-D and A’-D’ respectively. Scale bar in E is 1 mm and applies to E-H, scale bar in E’ is 200 µm and applies to E’-H’. Asterisks highlight fused neural and hemal arches. |
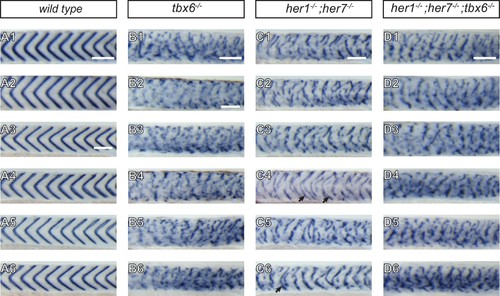
Severity of myotome boundary disruptions in tbx6, her1;her7 and her1;her7;tbx6 mutants differ according to genotype. (A1–D6) In situ hybridisation for myotome boundary marker xirp2a in six representative embryos for each genotype. (A1-A6) In wild type larvae, xirp2a staining delimits periodic, chevron-shaped boundaries. (B1–B6) In tbx6−/−, myotome boundaries are either fragmented or indistinct and xirp2a staining is visible in most of the axis. (C1–C6) In her1−/−;her7 −/−, myotome boundaries are fragmented and scattered in the trunk. Occasional chevron-shaped boundaries can be observed (arrows in C4 and C6). (D1–D6) Myotome boundary disorder of her1−/−;her7−/−;tbx6 −/− resembles tbx6−/−. Scale bars are 100 µm. Scale bar in A1 applies to A1-2, in A3 applies to A3-A6, in B2 applies to B2-B6, in C1 to C1-6 and in D1 to D1-6. Larvae are 36–41 hpf, shown in lateral view with anterior to the left. Images are taken from trunk abutting the yolk extension, corresponding to ~segments 7 to 17 in . |
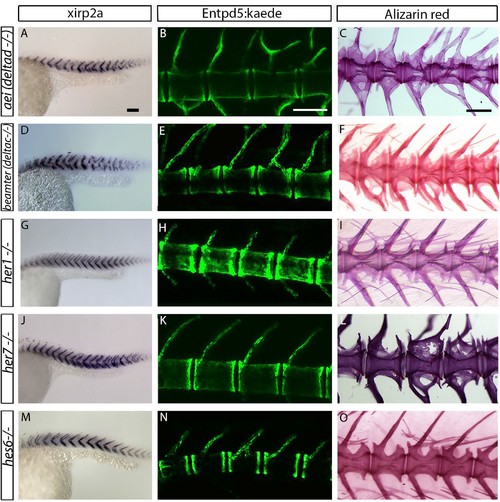
Centra are well-formed in deltaD, deltaC, her1, her7 and hes6 segmentation clock single gene mutants. (A, D, G, J and M) xirp2a myotome marker in situ hybridization at 27 hpf. (B, E, H, K and N) entpd5:kaede expression between 15 dpf and 20 dpf. (C, F, I, L, O) Alizarin Red bone stain in adults between 6 months and 1 year. Centra segmentation is normal in aei/deltaD, beamter/deltaC, her1, her7, and hes6 mutants. In aei/deltaD (A), bea/deltaC (D) and her7 (J) mutants, where the myotome boundaries are disordered only in the posterior trunk and tail, the neural and hemal arches of the caudal vertebrae are fused (B, C, E, F and L). All animals in lateral view with anterior to the left. Scale bars are 100 µm in A, D, G, J, M; 300 µm in B, E, H, K, N; and 0.6 mm in C, F, I, L, O). |

Segmentation clock gene double and triple heterozygous mutants have well-formed centra. (A, D, G, J, M, P, S) xirp2a myotome marker in situ hybridization at 27 hpf. (B, E, H, K, N, Q, T) entpd5:Kaede expression between 15 dpf and 20 dpf. (C, F, I, L, O, R, U) Alizarin Red bone preparations of adults between 6 months and 1 year of age. (A to L) Triple and double heterozygote embryos for her1, hes6 and her7, have wild type myotome boundaries, arches and chordacentra. (M) The her7;hes6 homozygous mutants have normal myotome segmentation (n = 36). At both embryonic (N (n = 5)) and adult stages (O (n = 6)) her7;hes6 mutants have well-formed centra and neural and hemal arches. (P) her1;hes6 mutants (n=15) and (S) her1;her7;hes6 mutants (n=9) have disordered myotome boundaries. In both cases, neural and hemal arches show fusions (arrow in Q and T) (Q (n = 3), R (n = 1), T (n = 5) and U (n = 6)) and small vertebrae (asterisk in Q and T) and fusion between two vertebrae (cross in R). All animals in lateral view with anterior to the left. Scale bars are 100 µm in A, D, G, J, M, P, S; 300 µm in B, E, H, K, N, Q, T; and 0.6 mm in C, F, I, L, O,R,U). |
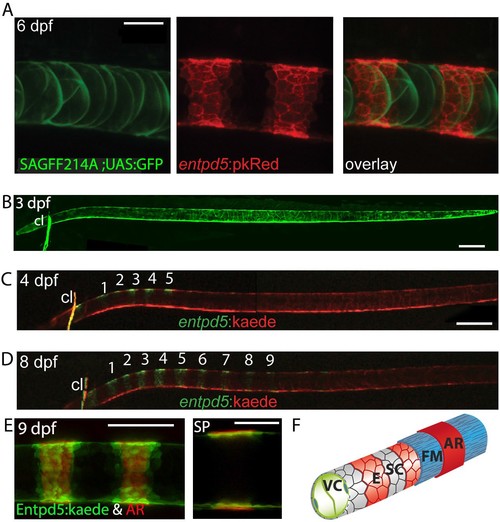
Segmental entpd5 expression in notochord sheath cells marks the sites of chordacentrum mineralization. (A-D) Confocal images of live transgenic entpd5 reporter larvae in lateral view with anterior to left. (A) At 6 dpf, entpd5 is expressed only in notochord sheath cells and not in vacuolated notochord cells, labelled by SAGFF214A;UAS:GFP. (B) At 3 dpf entpd5 is expressed in the whole notochord and does not display a segmented pattern. (C,D) Transgenic entpd5:Kaede embryos were photoconverted at 3 dpf and imaged at 4 dpf (C) and 8 dpf (D), respectively. New axial expression domains (green) are restricted to a segmental pattern within the axis and the cleithrum (cl). (E) Live confocal imaging of entpd5:Kaede expression in larvae also stained with Alizarin Red (AR) in lateral view (left) and sagittal view (SP). entpd5+ expression domains overlap with areas of mineralization (left), and notochord sheath cells (green) localize proximal to the site of mineralization of the future chordacentra. (F) Schematic illustration depicting the innermost vacuolated cells (VC) and the alternating pattern of entpd5+ (red, E) and entpd5- (grey) notochord sheath cells (SC). The sheath cells are surrounded by a fibrous matrix (FM), which in turn becomes mineralized in entpd5+ areas. cl, cleithrum. Scale bar for A and E is 40 µm, scale bar for B and C is 150 µm. EXPRESSION / LABELING:
|
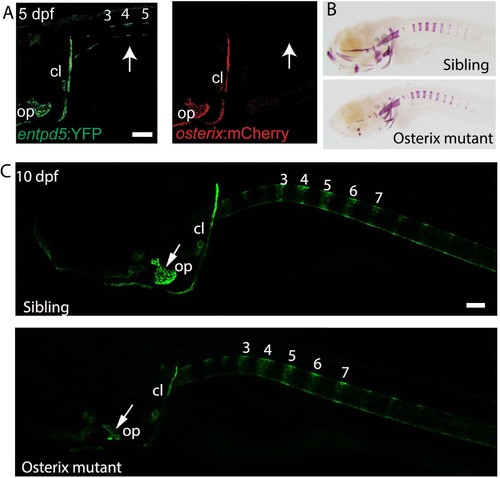
osterix is required for the formation of cranial bone structures, but not for the axial skeleton. (A) Lateral view of a transgenic entpd5:YFP; osterix:mCherry embryo. entpd5:YFP expressing cells are present at positions (arrows; numbers refer to prospective vertebrae 3–5) where mineralization of the vertebral centra are predicted to occur. osterix:mCherry expressing cells are not observed at these positions. (B) Lateral view of sibling and osterix mutant embryos, stained with Alizarin Red. Reduced mineralization seen in the head of mutants, but not around the notochord. (C) Lateral view of sibling and osterix mutant embryos, where all bone elements are labelled with entpd5:kaede. entpd5 expression is reduced in the craniofacial bones of the mutant compared with the sibling. The axial skeletons show no changes in vertebral expression pattern. All images are lateral views, with anterior to the left. Scale bars are 100 µm. |
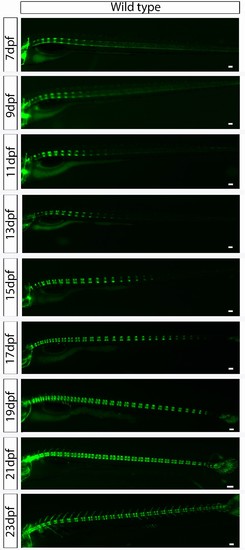
Wild type entpd5:kaede larvae develop axial segmentation in an orderly manner from anterior to posterior. Virtual time lapse of one larva from 7 dpf to 23 dpf showing entpd5 positive segment development in the axial skeleton progressing continuously from anterior to posterior, with regular distance between segments. Scale bars are 300 µm. |
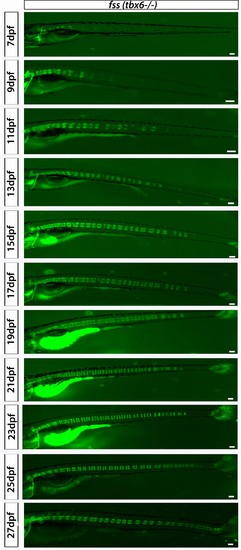
fss (tbx6−/−);entpd5:kaede larvae develop axial segmentation with occasional gaps that are later filled by a smaller entpd5+ ring domain. Virtual time lapse of one larva from 7 dpf to 27 dpf. Scale bars are 300 µm. |
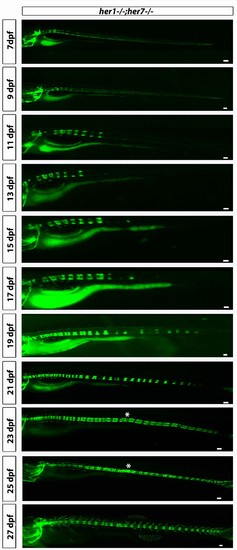
her1−/−;her7−/−;entpd5:kaede larvae develop axial segmentation in a disorganized manner, occasionally missing one or two segments or inserting additional segments. Fusions of adjacent chordacentra, non-regular entpd5+ segment shapes, thicker and thinner segments and a transient bending of the axis (asterisk) can be seen. Virtual time lapse of one larva from 7 dpf to 27 dpf. Scale bars are 300 µm. |
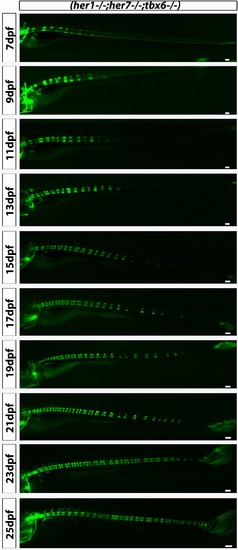
her1−/−;her7−/−;tbx6−/−;entpd5:kaede larvae showed disorganized axial segmentation. These defects are not as strong or as frequent as in her1−/−;her7−/−, but gaps in segmentation, insertion of additional segments, fusions of adjacent centra, non-regular entpd5+ segment shapes, thicker and thinner segment can still be seen. Scale bars are 300 µm. |
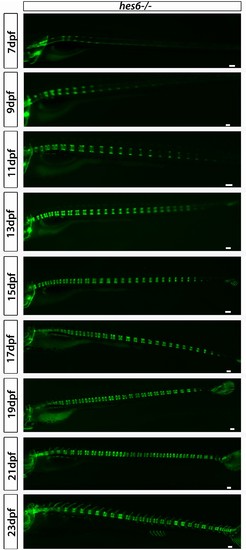
hes6−/−;entpd5:kaede larvae segment their axis in an orderly manner. Even though segmentation is overtly normal, the hes6 mutant forms fewer chordacentra than wild type, as expected. Scale bars are 300 µm. |
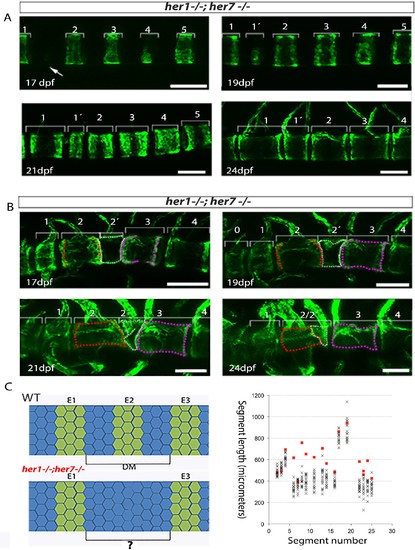
Inaccurate spacing of entpd5+ segments results in erroneous chordacentrum formation. (A, B) Time series images of entpd5+ segments around the notochord in her1;her7 mutants, in lateral view with anterior to the left. (A) An atypically wide space between entpd5+ segments (arrow) results in the subsequent intercalation of an additional, smaller entpd5+ segment (1´). (B) An additional smaller segment (2') fuses to adjacent vertebra. (C) The length between existing entpd5+ segments was measured in her1;her7 mutants (n = 4) in positions where an entpd5 ring would be intercalated (red dots) and compared to the equivalent axial position in wild type (WT, n = 16) (black crosses). The distance preceding an intercalation in her1;her7 mutants was either similar or larger than wild type. DM, distance measured; E entpd5+ segment. All scale bars are 100 µm. PHENOTYPE:
|
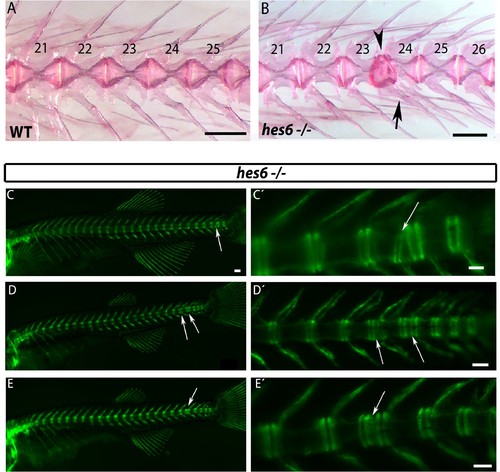
hes6 mutant embryos can form defective caudal vertebrae. (A,B) Alizarin Red bone preparations of wild type and hes6−/− adults. (B) 27% of hes6−/− adult bone stains presented with defects in caudal chordacentra (n=4/15) wildtype. Arrow points at fused hemal arches, arrow head at chordacentra segment defect. (C to E´) entpd5:YFP expression in hes6 mutants at 28 dpf . 20% of hes6 mutants have one or more defective small vertebrae (arrows) exclusively in the caudal axis (n=8/41). Scale for A and B is 2.5 mm, C is 300 µm and C´ to E´ is 200 µm. PHENOTYPE:
|
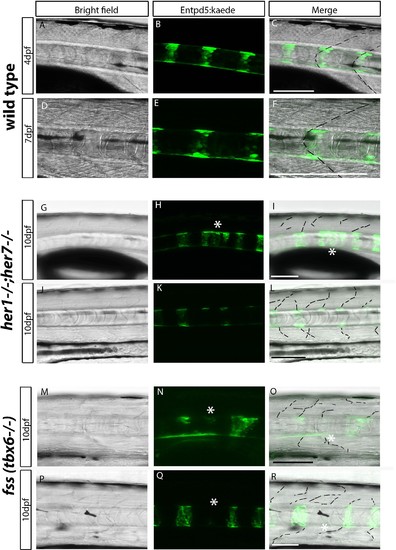
Chordacentra always align with the myotome boundaries in wild type larvae, but not in mutants. (A-R) Live confocal images of entpd5:Kaede in the trunk of wild type, her1−/−;her7−/− and fss (tbx6−/−) larvae, in lateral view, anterior to the left. (A-F) Live images at 4 dpf and 7 dpf show entpd5:kaede positive notochord segments (B and E) are aligned with the myotome boundary (A and D) in wild types. In her1;her7 (G-L) and tbx6 (M-R) mutants at 10 dpf, the myotome boundaries are disrupted and are no longer in strict alignment with the entpd5:kaede segment. Asterisks (*) denote defects in axial segmentation; dashed lines trace myotome boudaries and boudary fragments. Scale bars are 100 µm. |