
- Title
-
Age-related islet inflammation marks the proliferative decline of pancreatic beta-cells in zebrafish
- Authors
- Janjuha, S., Singh, S.P., Tsakmaki, A., Mousavy-Gharavy, N., Murawala, P., Konantz, J., Birke, S., Hodson, D.J., Rutter, G., Bewick, G., Ninov, N.N.
- Source
- Full text @ Elife
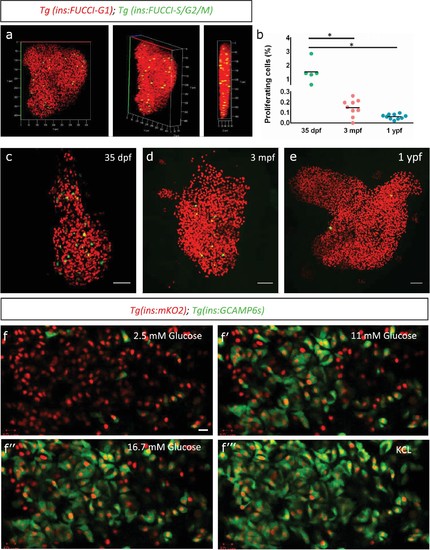
Beta-cell proliferation declines with age. (a) 3D-rendering of a primary islet from Tg(ins:Fucci-G1);Tg(ins:Fucci-S/G2/M) animals at 3 mpf showing nuclear Tg(ins:Fucci-G1) (red) and Tg(ins:Fucci-S/G2/M) (green) expression. (b) Quantification of percentage of Tg(ins:Fucci-S/G2/M)-positive and Tg(ins:Fucci-G1)-negative (green-only) beta-cells at 35 dpf (n = 5), 3 mpf (n = 9) and 1 ypf (n = 10) animals. Each dot represents one animal. Horizontal bars represent mean values (one-way ANOVA, *p<0.05). (c, d, e) Confocal projection of whole-mount islets from Tg(ins:Fucci-G1);Tg(ins:Fucci-S/G2/M) animals at 35 dpf, 3 mpf and 1 ypf. Anterior to the top. Scale bar 50 µm. (f) Ex vivo live-imaging of beta-cells from Tg(ins:nlsRenilla-mKO2);Tg(ins:GCaMP6s) animals at 3 mpf. Beta-cells (red) were stimulated with 2.5 (basal) mM D-Glucose, (f’) 11 mM D-glucose, (f’’) 16.7 mM D-glucose and (f’’’) depolarized using 30 mM KCl while monitoring GCAMP6s-fluorescence (green). Scale bar 10 µm. |

Beta-cell proliferation declines with age in secondary islets. (a,b) Confocal projection of whole-mount secondary islets from Tg(ins:Fucci-G1);Tg(ins:Fucci-S/G2/M) animals at 35 dpf, 3 mpf and 1 ypf. Scale bar 20 µm. (c) Quantification of percentage of Tg(ins:Fucci-S/G2/M)-positive and Tg(ins:Fucci-G1)-negative (green-only) beta-cells from 35 dpf (n = 8 fish, secondary islets = 16), 3 mpf (n = 8 fish, secondary islets = 70) and 1 ypf (n = 8 fish, secondary islets = 76) animals. Error bars show s.e.m. (one-way ANOVA, *p<0.05). |

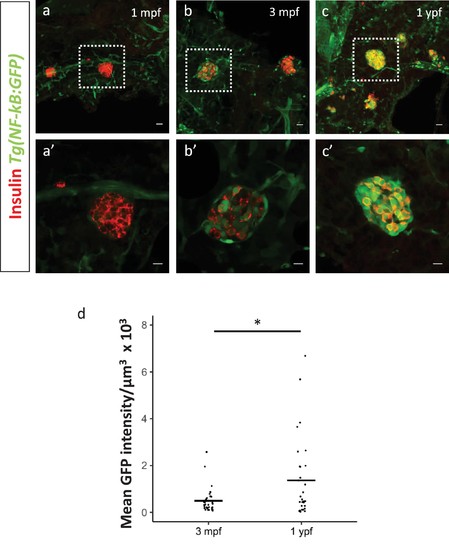
An inflammation reporter reveals heterogeneous activation of NF-kB signaling in beta-cells with age. (a) The images show single confocal planes from islets of 5 dpf larvae. The tnfrsf1b coding sequence was expressed under the control of the insulin promoter. The plasmid was injected in Tg(NF-kB:GFP) embryos at the one-cell-stage, leading to mosaic and stochastic expression of the construct in beta-cells. The Tg(NF-kB:GFP) reporter expresses GFP (green) under the control of six tandem repeats of NF-kB DNA-binding sites. Beta-cells were labelled using an insulin antibody (red). Arrows indicate GFP-positive beta-cells. Scale bar 5 µm. (b) The graph shows the percentage of GFP-positive and insulin-positive cells in uninjected controls (n = 5) and tnfrsf1b injected animals (n = 6) at 5 dpf. Horizontal bars represent mean values. (c–e) Confocal stack of islets from Tg(NF-kB:GFP) animals at 1 mpf, 3 mpf and 1 ypf. Beta-cells were labeled using an insulin antibody (red). NF-kB:GFP reporter expression is shown in green. Scale bars 20 µm. (c’–e’) Insets show high magnification single planes of the confocal stacks (corresponding to the regions shown using white dotted-lines in the top panels). Scale bar 10 µm. (f–g) Beta-cells from 3 mpf Tg(NF-kB:GFP) animals were labeled with TSQ (Zn2+ labeling dye) and analyzed using FACS. The graph shows GFP intensity (along the X-axis) and the distribution of beta-cells at 3 mpf and 1 ypf. Horizontal lines indicate the division point between GFPlow and GFPhigh levels. Percentage values represent proportion of cells with GFPlow or GFPhigh expression. |
Activation of NF-kB signaling in beta-cells of the secondary islets with age. (a,b,c) Confocal stack of secondary islets from Tg(NF-kB:GFP) animals at 1 mpf, 3 mpf and 1 ypf. Beta-cells were labeled using an insulin antibody (red). NF-kB:GFP reporter expression is shown in green. Scale bars 20 µm. (a’,b’,c’) Insets show high-magnification single planes of the confocal stacks corresponding to the regions outlined using white dotted-lines in the top panels. Scale bar 10 µm. (d) Graph showing the total normalized GFP fluorescence intensity of the secondary islets from 3 mpf (n = 9 fish, secondary islets = 32) and 1 ypf (n = 8, secondary islets = 30) animals. Each dot represents one islet (two-tailed t-test, *p<0.05). |
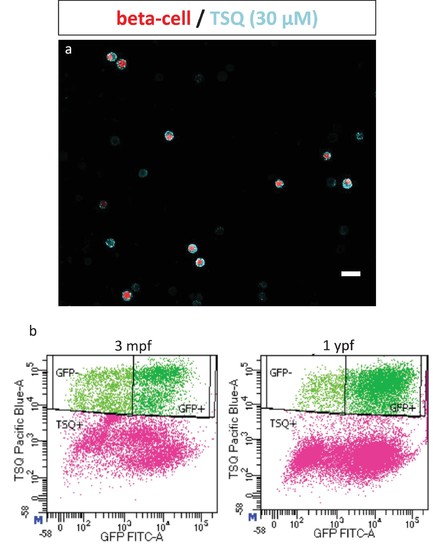
Fluorescent activated cell sorting of NF-kB:GFPhigh and NF-kB:GFPlow beta-cells. (a) Confocal image of dissociated cells from dissected islets of 3 mpf Tg(ins:nlsRenilla-mKO2) animals that were labeled with TSQ (Zn2+ labeling dye). Islets were incubated with TSQ after dissociation and imaged using a confocal microscope. Beta-cells show RFP expression (red) while cells rich in Zn2+ are labeled with TSQ (cyan). TSQ strongly labels all beta-cells and weakly labels some unknown endocrine cells. (b) Fluorescent activated cell sorting (FACS) of live TSQ-positive GFPhigh and GFPlow cells from Tg(NF-kB:GFP) animals at 3 mpf and 1 ypf. Dead cells were labelled using far-red stain DRAQ7. |
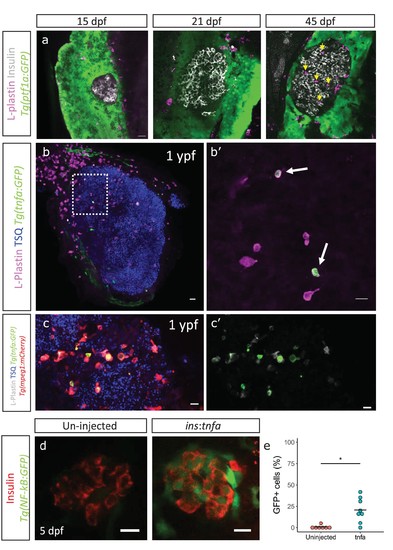
Immune cells infiltrate the islet during development and persist throughout adult life. (a) Confocal images of pancreata from 15, 21 and 45 dpf animals. Beta-cells were labeled using an insulin antibody (grey), leukocytes were labeled using an L-plastin antibody (magenta) and Tg(ptf1a:GFP) marks the acinar cells (green). Immune cells are present within the islet at 45 dpf (arrows). (b) Confocal images of whole islets from Tg(tnfα:GFP) animals at 1 ypf. Islets were labeled using TSQ (Zn2+ labeling dye) (blue), leukocytes were labelled with an L-plastin antibody (magenta) and Tg(tnfα:GFP) marks cells expressing tnfα (green). Scale bars 20 µm. (b’) Insets show high-magnification single planes from the confocal stacks (corresponding to the area marked using a white dotted-line in b). Scale bar 10 µm. (c–c’) Confocal image of a one ypf islet showing a single plane. The TgBAC(tnfα:GFP) line marks the tnfα-positive cells (green), whereas Tg(mpeg1:mCherry) marks the macrophages (red). The L-plastin antibody marks all leukocytes (grey) and TSQ (Zn2 +labeling dye) was used to mark the islet (n = 5). Scale bar, 10 µm. (d) Confocal images showing islets at five dpf. The tnfα cDNA was expressed under the insulin promoter. The plasmid was injected in Tg(NF-kB:GFP) embryos at the one-cell-stage and the islets were analyzed at 5 dpf. Beta-cells were labeled with an insulin antibody (red). Tg(NF-kB:GFP) reporter expression is shown in green. (e) The graph shows the percentage of GFP and insulin double-positive cells in un-injected controls (n = 7) and ins:tnfα injected animals (n = 8) at five dpf. Horizontal bars represent mean values (two-tailed t-test, *p<0.05). |

Immune cells infiltrate the islet during development. (a,a’) Confocal image of a juvenile islet. Tg(ins:CFP-NTR) line marks the beta-cells with CFP (green), leukocytes were labelled with the L-plastin antibody (blue) and Tg(mpeg1:mCherry) marks the macrophages (red). (b) Quantification of the percentage of TgBAC(tnfa:GFP) and L-plastin double-positive cells over the total number of L-plastin-positive cells in the islets of TgBAC(tnfa:GFP) animals at 3 mpf (n = 5) and 1 ypf (n = 5). Horizontal bars represent mean values (two-tailed t-test, p>0.05). (c) Quantification of the total number of TgBAC(tnfα:GFP)-positive and L-plastin double-positive cells at 3 mpf (n = 5) and 1 ypf (n = 5). Horizontal bars represent mean values (two-tailed t-test, p>0.05). (d) Quantification of the total number of L-plastin positivecells at 3 mpf (n = 5) and 1 ypf (n = 5). Horizontal bars represent mean values (two-tailed t-test, p>0.05). |

NF-kB:GFPhigh beta-cells proliferate less than their neighbors. (a) Schematic showing the EdU (5-ethynyl-2′-deoxyuridine) incorporation assay. Tg(NF-kB:GFP) animals were incubated in EdU at 3 mpf for two consecutive nights and fed during each day. (b) EdU incorporation assay was performed to mark the proliferating beta-cells in Tg(NF-kB:GFP) animals at 3 mpf. The confocal image (single plane) shows an overview of a section through the islet. Beta-cells were labeled with an insulin antibody (red), a GFP antibody (green) and EdU (blue). Arrowheads point to EdU-positive beta-cells. (b’–b’’) The insets show higher magnification images with and without the EdU channel. EdU incorporation can be observed in some of the GFPlow cells (white arrow-heads). (c) An insulin-positive cell was first located by going through individual sections in the confocal z-stack. The optical section containing the largest area of the nucleus was chosen as the center of the cell. A region-of-interest (ROI) was drawn around the nucleus and the fluorescence intensities of the GFP and DAPI channels were recorded. The normalized GFP intensity was calculated as a ratio of mean GFP intensity and mean DAPI intensity for each ROI. The average total normalized GFP-intensity of each islet was set as a threshold for dividing the cells into GFPhigh and GFPlow populations. The graph shows the percentage of EdU and insulin double-positive cells among the GFPhigh and GFPlow populations. Each dot represents one islet (n = 9). Horizontal bars represent mean values (two-tailed t-test, *p<0.05). (d) The graph shows the percentage of PCNA and insulin double-positive cells among the GFPhigh and GFPlow populations. Each dot represents one islet (n = 13). Horizontal bars represent mean values (two-tailed t-test, *p<0.05). See also Figure 5—figure supplement 2 for representative PCNA antibody staining. |

The GFP fluorescence of the transgenic reporterTg(NF-kB:GFP)remains stable for 72 hours in beta-cells. (a,b,c) Beta-cells from Tg(NF-kB:GFP);Tg(ins:mCherry) animals at 3 mpf were FAC-sorted as single cells in 384-well plates and followed over 72 hr. NF-kB:GFPhigh cells at 24, 48 and 72 hr post-FAC-sorting. Scale bar 5 µm. (a’,b’,c’) NF-kB:GFPlow cells at 24, 48 and 72 hr post-FAC-sorting. Scale bar 5 µm. (d) Quantification showing the mean GFP fluorescence intensity of GFPhigh and GFPlow cells (n = 7 GFPhigh cells and n = 5 GFPlow cells). |

Proliferating cell nuclear antigen (PCNA) antibody staining shows that NF-kB:GF Phighbeta-cells proliferate less than NF-kB:GFP low beta-cells. (a) Islets were stained for PCNA to mark the proliferating beta-cells in Tg(NF-kB:GFP) animals at 3 mpf. The confocal image (single plane) shows an overview of a section through the islet. The sections were stained with an insulin antibody (red), a GFP antibody (green) and PCNA (blue). (a’–a’’) The insets show higher magnification images. PCNA can be observed in some of the GFPlow cells (white arrow-heads). |

Socs2 is enriched in NF-kB:GFPhigh cells and inhibits beta-cell proliferation in a cell-autonomous manner. (a) Schematic showing the sorting of beta-cells from the double transgenic line Tg(ins:mCherry);Tg(NF-kB:GFP) at 3 mpf into GFPhigh and GFPlow cells using FACS. (b) Bulk RT-qPCR was performed on the GFPhigh and GFPlow beta-cells (n = 3 to 4 biological replicates, n = 3 animals per replicate, 1000 cells per condition). Candidate genes significantly enriched in beta-cells at 1 ypf were chosen to be compared between the GFPhigh and GFPlow populations at 3 mpf. The graph shows relative fold-change between GFPhigh and GFPlow cells. The expression of all genes was normalized to β-actin expression before calculating fold-change. socs2 shows higher expression in the GFPhigh cells. Error bars, SD (two-tailed paired t-test, *p<0.05). (c) Schematic showing the method for mosaic overexpression of candidate genes in beta-cells. The socs2 coding sequence is linked to nuclear-CFP using a T2A sequence. The entire construct was expressed under the insulin promoter. This construct was injected in one-cell-stage-embryos from Tg(ins:Fucci-G1);Tg(ins:Fucci-S/G2/M) animals leading to mosaic and stochastic expression of socs2 in beta-cells during islet development. Control animals were injected with plasmid containing only nuclear-CFP sequence (See Figure 6—figure supplement 2). (d) Confocal projections showing mosaic expression of socs2-T2A-CFP (blue) at 23 dpf (blue). Proliferating beta-cells are marked by Tg(ins:Fucci-S/G2/M) expression (green) and absence of Tg(ins:Fucci-G1) expression (red). Anterior to the left. Scale bar 10 µm. (d’) Insets show higher magnification single planes from the confocal stacks (white dotted-line in d) with separate channels. The proliferating beta-cells are CFP-negative (yellow arrowheads), whereas some of the non-proliferating cells are CFP-positive (white arrowheads) (e) Quantification of the percentage of Tg(ins:FUCCI-S/G2/M)-positive and Tg(ins:FUCCI-G1)-negative (green only) beta-cells. The socs2 expressing β-cells exhibit reduced cell-cycle progression compared to wild-type neighbors (n = 9). Horizontal bars represent mean values (two-tailed t-test, *p<0.05). |

Mosaic expression of candidate genes in beta-cells to study their effect on proliferation. (a,b,c) Confocal images showing mosaic expression of nuclear-CFP (a), CFP-T2A-spry4 (b) and CFP-T2A-rapgef4 (c) at 23 dpf. Tg(ins:Fucci-G1) expression is shown in red, Tg(ins:Fucci-S/G2/M) expression in green and CFP expression in blue. Anterior to the top. Scale bar 20 µm. (a’,b’,c’) Quantification of the percentage of Tg(ins:FUCCI-S/G2/M)-positive and Tg(ins:FUCCI-G1)-negative (green only) beta-cells among the CFP-positive and CFP-negative sub-populations for each experiment shown in the left-hand panels. Horizontal bars represent mean values (two-tailed t-test, p>0.05). |