
- Title
-
Spine Patterning Is Guided by Segmentation of the Notochord Sheath
- Authors
- Wopat, S., Bagwell, J., Sumigray, K.D., Dickson, A.L., Huitema, L.F.A., Poss, K.D., Schulte-Merker, S., Bagnat, M.
- Source
- Full text @ Cell Rep.

The Notochord Sheath Displays a Segmented Pattern Prior to Vertebral Body Formation (A) Live confocal imaging of notochord segmentation (denoted by brackets) and osteoblast recruitment (arrows) in col9a2:GFPCaaX and osx:mcherry-NTR fish. (B) Live confocal imaging showing that osteoblasts specifically migrate to col9a2-negative domains (brackets) in an anteroposterior manner. (C) Live imaging of calcein stained col9a2:mcherry fish showing that col9a2-negative domains (denoted by asterisks) become mineralized. Developmental stages are based on standard length. All scale bars are 100 μm. Images in (A) and (C) are digitally stitched. |

The Notochord Sheath Segments into Alternating Domains Prior to Spine Morphogenesis (A) Live confocal images showing alternating entpd5a:pkRED (solid brackets) and col9a2:GFPCaaX segments (dotted brackets) in the notochord sheath of a 4.5 mm SL fish. Numbers represent the entpd5a segments used for quantifications. (B) At 4.0 mm SL, entpd5a:pkRED expression produces segments that expand over time and completely mirror centra. (C) entpd5a+ segment length (red tones), monitored in segments 8–12, increases as col9a2+ domain (green tones) length decreases in three individual fish. (D) The number of cells within entpd5a+ segments increase via the transition of adjacent col9a2+ cells were measured in three individual fish. ∗Cells could not be counted accurately because of crowding. (E) Monitoring the appearance of entpd5a+ segments over time indicates new segments form sequentially every 8 hr. Between 15 and 32 fish were quantified for each time point. Means and SDs are displayed for each time point. (F) Confocal image of a 4.75 mm SL fish showing that segregation of alternating entpd5a+ (solid brackets) and col9a2+ (dotted brackets) segments in the notochord sheath precedes osteoblast recruitment (cyan; marked by osx), which are observed only in the oldest, most anterior segments (denoted by arrows). (G) Confocal image of a 7.25 mm SL fish showing that entpd5a:pkRED expression (arrowheads) underlies osteoblasts, marked by Tg(osx:mTagBFP-2A-CreER) expression, in the spine centra (arrows), while col9a2:GFPCaaX expression is confined to the IVD (dotted brackets). Right: a zoomed-in z-slice of dotted box in left image. Developmental stages are based on standard length. Scale bars are 100 μm. Asterisk denotes interference in optical path. Images in (A), (B), and (F) are digitally stitched. See also Figure S1. |

The Notochord Sheath Segments into Cartilage-like and Mineralizing Domains of Gene Expression (A) Notochord sheath cells expressing col9a2:GFPCaaX and entpd5a:pkRED produce three cell populations: col9a2+ (green bracket), double-positive (yellow bracket), and entpd5a+ at 13 dpf or approximately 4.25 mm SL. In the same fish, mature or anterior segments express double-positive cells at borders between domains. New, more posterior segments consist of double-positive cells. Scale bar is 50 μm. (B) Heatmap of differentially expressed genes (DEG) using scaled counts shows that the three cell populations possess distinctive clusters of upregulated genes. The color gradient indicates measures of SDs from the mean expression level of each gene. (C) Heatmap visualization of genes within functionally annotated col9a2+, double-positive, and entpd5a+ populations show enrichment in genes linked to cartilage development, somite segmentation, and mineralization, respectively. (D) Lists of top GO terms and KEGG pathways. (E) Confocal imaging of transgenic reporter id2a:GFPCaaX shows dynamic expression in the notochord sheath specific to the double-positive domain. Imaging of sox9b:eGFP shows that expression in the notochord sheath is specific to the col9a2+ domain. Developmental stages are based on standard length. Scale bars are 100 μm. Images in (A) and (E) are digitally stitched. See also Figures S2 and S3 and Tables S1 and S2. |

Activation of Notch Signaling in Alternating Sheath Domains Drives Notochord Segmentation (A) At 3.7 mm SL, expression of entpd5a:pkRED and TP1:VenusPest, a reporter for Notch activation, shows that Notch signaling is active in double-positive and entpd5a+ domains during the formation of new segments (arrows). (B) At 5.3 mm SL, expression of TP1:VenusPest persists in mature entpd5a+ segments. (C) Formation of new entpd5a+ segments is halted upon treatment with 100 μM DAPT in 7 dpf larvae (DAPT treated, n = 9; DMSO treated, n = 6; p = 0.013) for 24 hr (see schematic; red dots indicate imaging time point). Control embryos treated with DMSO still form two or three segments (graph). Forty-eight hours following the washout of DAPT, entpd5a+ segment formation is recovered (arrows) in DAPT-treated fish. Scale bars for (A)–(C) are 100 μm. (D) Photobleaching of a single TP1+ segment (red box) in a 4.0 mm larva shows that TP1 expression is significantly recovered by 4 hr (arrow). (E) Recovery of the photobleached TP1+ segment (red box) is complete by 21 hr in DMSO but not in 100 μM DAPT. Scale bars for (D) and (E) are 50 μm. |

Alteration of Notochord Sheath Segmentation Produces Matching Defects in Spine Segmentation (A) Bright-field imaging of entpd5a:pkRED expression in the notochord sheath using the QF2/QUAS system to overexpress GFP does not alter segmentation. Vertebrae length measurements in 30 dpf fish were normalized to standard length (n = 19). (B) Constitutive activation of Notch signaling via expression of QUAS:nlsVenus-V2a-notch1aICD within the notochord sheath generates patchy entpd5a:pkRED segments at 14 dpf. At 21 dpf, some mature notochord segments are wedged, incomplete (cyan arrows), or irregularly sized (magenta arrows). Alizarin red staining revealed the same defects in the spine. Quantification of vertebra length normalized to the standard length showed highly variable size, particularly in the anterior portion of the spine, significantly deviating from the GFP control (n = 20, p = 0.0001). (C) Inhibition of Notch signaling via expression of QUAS:nVenus-V2a-SuHDN resulted in partial or skipped entpd5a:pkRED segments producing gaps in the posterior region of the notochord at 14 dpf (dotted bracket). At 21 dpf, smaller entpd5a segments (magenta arrows) fill in gaps. Alizarin staining shows that these defects resulted in irregular spacing and fusions of vertebrae (magenta arrows). Measurements of vertebra length normalized to standard length showed irregularly sized vertebrae, particularly in the posterior portion of the spine, but the majority of these measurements did not differ significantly from the GFP control (n = 16). (D) Misexpression of mespbb generates partial (cyan arrow) and variably sized segments (brackets) at 14 dpf. The same defects were observed at 21 and 30 dpf in the mature spine at the same positions. Vertebrae length measurements showed high variability throughout the spine axis, significantly different from the GFP control (n = 22, p = 0.0104). Onset and level of mespbb misexpression were attenuated by injection of QS mRNA. Scale bars are 500 μm. Vertebrae position started with the first rib-bearing vertebra to the last caudal vertebra. We did not include the Weberian apparatus or the tail vertebrae in our analysis. The p values for vertebrae length comparisons were calculated from a one-way ANOVA with Dunnett’s multiple-comparisons test. Skeletal preps were converted to black-and-white images and inverted to better highlight defects. Floating bars in graphs display the minimum and maximum range for normalized vertebrae length (mm). Lines denote median values. See also Figures S4–S6. |

Somite Boundaries Influence the Spatial Distribution of Notochord Sheath Segments (A) Bright-field imaging of entpd5a:pkRED at 14 dpf tbx6 mutants (fssti1) shows that notochord segments (brackets) exhibit high size variability compared with their wild-type (WT) siblings. Following the same fish at 21 dpf, the same pattern was also observed. At 30 dpf, alizarin red stains show that mutants develop severely deformed arches (magenta arrows) and variably sized centra. (B) Quantification of centra length in calcein stained tbx6 mutants (fssti1) at 21 dpf showed greater variability compared with WT siblings (n = 14 and 11 for mutant and WT, respectively, p ≤ 0.0001). (C) Embryos were exposed to 100 μM DAPT or DMSO treatment at 7 hr post-fertilization (hpf) for 3 hr (red dot indicates imaging time point). (D) Embryos exposed to 100 μM DAPT develop focal defects in somite segmentation (cyan box outlines disrupted somite boundaries traced with dotted pink lines). Bright-field imaging of 14 dpf entpd5a:pkRED showed defects in notochord segment size and spacing (brackets) after DAPT was washed out compared with control DMSO-treated animals. Scale bars are 500 μm. |

Alternating segments in the notochord sheath are generated in an anteroposterior direction, Related to Figure 2. Confocal images showing the development of alternating entpd5a:pkRED+ and col9a2:GFPCaaX+ segments in the notochord sheath from early (4.0mm SL) to late stages (6.5mm SL). Scale bars are 100 μm. All images have been digitally stitched. Dotted line (bottom panel) indicates where two images were manually stitched together due to specimen displacement. |

in situ hybridization of mespbb reveals segmented expression in the notochord sheath, Related to Figure 3. Cryo-sections of 10 dpf larvae show expression of the mespbb transcript in notochord sheath cells in a segmented pattern (arrows) that correlates with somite boundaries (dotted lines). Scale bars are 50 μm. Red dotted line (bottom panel) indicates where two images were manually stitched together. EXPRESSION / LABELING:
|
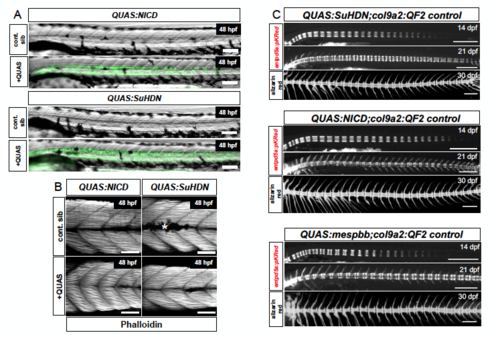
Somite boundaries are unaffected by genetic manipulations in the notochord, Related to Figure 5. (A) Brightfield imaging of col9a2:QF2 x QUAS:nlsVenus-V2a-notch1aICD (QUAS:NICD) or QUAS:nVenus-V2a-SuHDN (QUAS:SuHDN) crosses show that QUAS expression does not affect somite patterning or boundary formation at 48 hpf. (B) Phalloidin staining of 48 hpf embryos did not show defects in somite organization compared to clutch-mate controls. White (*) denotes pigmentation. Scale bars for (A) and (B) are 100 μm. (C) Control siblings from QF2 x QUAS crosses, i.e. expressing one or no transgene, did not present defects in notochord or spine segmentation. Scale bars are 500 μm. |
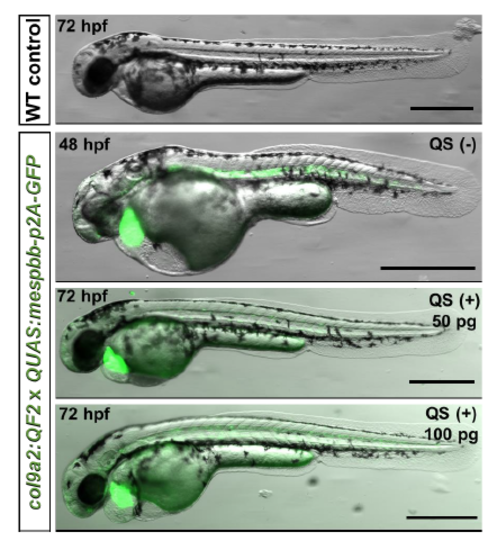
Delayed expression of QUAS:mespbb-p2A-eGFP bypasses early embryonic defects, Related to Figure 5. Compared to siblings lacking transgenic expression, col9a2:QF2;;QUAS:mespbb-p2A- eGFP fish expressing both transgenes had severe defects. Injection of 50 pg or 100 pg of QS RNA (Potter et al., 2010) delayed onset of mespbb-p2A-eGFP expression and partially rescued early developmental defects. Scale bars are 100 μm. |