- Title
-
Early life exposure to ethinylestradiol enhances subsequent responses to environmental estrogens measured in a novel transgenic zebrafish
- Authors
- Green, J.M., Lange, A., Scott, A., Trznadel, M., Wai, H.A., Takesono, A., Brown, A.R., Owen, S.F., Kudoh, T., Tyler, C.R.
- Source
- Full text @ Sci. Rep.
|
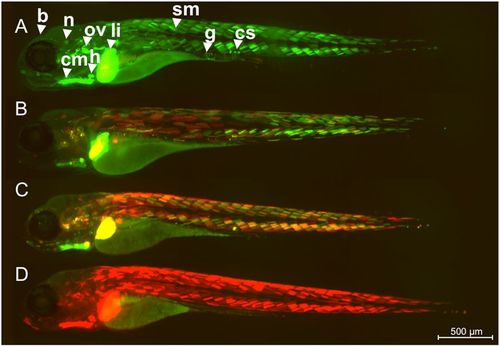
Kaede conversion analysis. ERE-Kaede-Casper larvae were exposed to 100 ng EE2/L over the period 0–5 dpf and imaged at 5 dpf either without UV exposure (A), or after exposure to UV at 3 dpf (B), 4 dpf (C) and 5 dpf (D) to convert Kaede fluorescence from green to red. Specific tissue response in the liver (li), heart (h), somite muscle (sm), otic vesicle (ov), cardiac muscle (cm), corpuscle of Stannius (cs), brain (b), neuromast (n), and gut (g). |
|
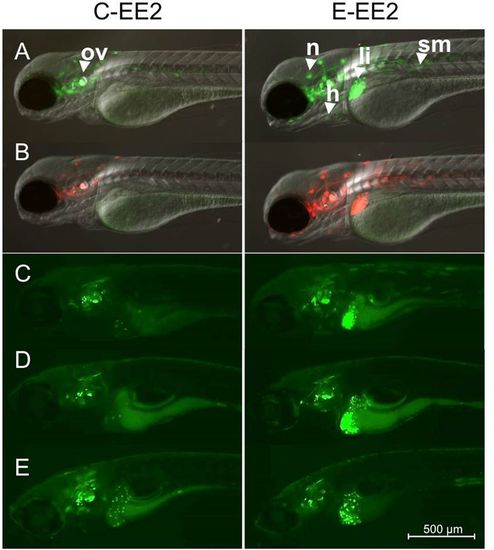
Sensitivity to ethinylestradiol for repeated exposures. Control (non-exposed) larvae and larvae exposed initially to 10 ng EE2/L over the period of 48 h (0–2 dpf) were imaged at 3 dpf (A) and the Kaede response was then converted fully from green to red fluorescence via UV exposure (B). Both groups of photoconverted larvae (control and EE2-exposed) were then exposed to 10 ng EE2/L over the period 3–5 dpf (C), 5–7 dpf (D) or 9–11 dpf (E) and imaged on the final day of exposure (n = 18). Newly generated Kaede expression (green fluorescence) in liver, heart and somite muscle green was quantified by image analysis. All images were acquired by inverted compound microscope using a 5× objective. (A) and (B) images were acquired using GFP, RFP and DIC filters. (C), (D), and (E) are presented with the GFP filter only. Specific tissue response in the liver (li), heart (h), somite muscle (sm), otic vesicle (ov) and neuromast (n). |
|
Image analysis. Fluorescence induction for specific tissues was quantified via initially manually masking that tissue (see: yellow outline for liver (A), heart (B) and somite muscle (C) and quantified using ImageJ™ software. |
|
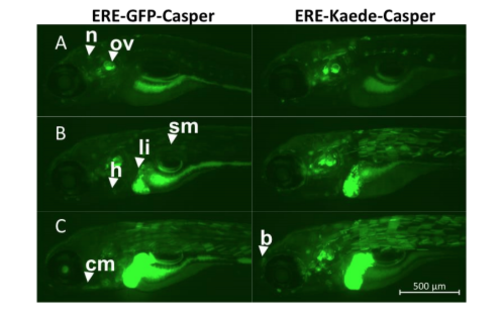
Comparison of ERE-GFP-Casper and ERE-Kaede-Casper models. Sensitivity and tissue response of the two models were compared via imaging after 0-5 dpf exposures to embryo water (A), 5 ng/L EE2 (B) and 10 ng/L EE2 (C). All images were acquired by inverted compound microscope (Zeiss Axio Observer) using a 5x objective. Images are presented with the GFP filter only. |
|
Temporal analysis of fluorescence induction after a single 48h exposure exposure to EE2. ERE-Kaede-Casper embryos were exposed to 10 ng/L and 50ng/L EE2 for 48 hours then washed and incubated in embryo water up to 5 dpf. At intervening 24 hour timepoints larvae were imaged to assess new Kaede expression, then immediately exposed to UV light to photoconvert Kaede fluorescence from green to red. All images were acquired by inverted compound microscope (Zeiss Axio Observer) using a 5x objective. Images are presented with the GFP filter only and therefore only 24 hours worth of Kaede expression is shown in each image. |
|
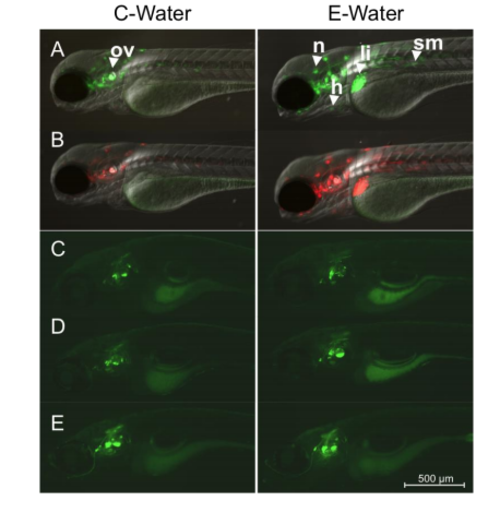
Kaede expression in control groups C-Water and E-Water. Control (nonexposed) larvae and larvae that were exposed initially to 10 ng EE2/L over the period 0-2 dpf were imaged at 3 dpf (A) and the Kaede response then converted fully from green to red fluorescence via UV exposure (B). Both groups of larvae (control and EE2-exposed) were then exposed to embryo water over the period 3-5 dpf (C), 5-7 dpf (D) or 9-11 dpf (E) and imaged on final day of exposure (n=18). Newly generated Kaede expression (green fluorescence) was not observed (there was some auto-fluorescence). All images were acquired by inverted compound microscope (Zeiss Axio Observer) using a 5x objective. A and B images were acquired using GFP, RFP and DIC filters. C, D, and E are presented with the GFP filter only. |


