- Title
-
Protease signaling regulates apical cell extrusion, cell contacts, and proliferation in epithelia
- Authors
- Schepis, A., Barker, A., Srinivasan, Y., Balouch, E., Zheng, Y., Lam, I., Clay, H., Hsiao, C.D., Coughlin, S.R.
- Source
- Full text @ J. Cell Biol.
|
Par2b deficiency prevents grossly abnormal skin morphology in hai1a morphants. (A–D) Wild-type or par2b−/− embryos were injected with the indicated MOs and imaged at 30 hpf. Images of control (A), hai1a morphant (B), par2b−/−:hai1a morphant (C), and par2b−/− embryos (D) are shown. Note the presence of cell clusters on hai1a morphants (B, arrowheads) and their absence on controls and Par2b-deficient hai1a morphants. Bar, 200 µm. (E) Percentage of embryos with cell clusters. 100 or more embryos were analyzed for each condition; mean ± SEM for three independent experiments is shown. Statistical analysis was performed using one-way ANOVA and Bonferroni posttest. The hai1a morphant was different from all other groups (P < 0.0001). PHENOTYPE:
|
|
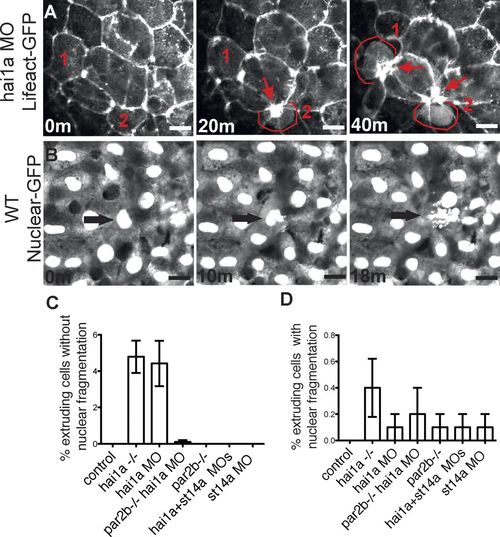
par2b-dependent apical extrusion of epithelial cells from periderm in hai1a morphant embryos. (A) The yolk sac periderm of a hai1a morphant periderm-LifeActGFP embryo was imaged from 28 to 46 hpf. Three time-lapse panels spanning 40 min show an F-actin ring that contracts around cells being extruded apically from the periderm. Cells destined to extrude are labeled 1 and 2 in all panels and are highlighted with red outline after extrusion has begun. Contracted actin rings remaining at the site of extrusion and at the center of rosettes formed by surrounding cells are marked by red arrows. Bar, 5 µm. (B) The yolk sac periderm of a control periderm-nuclear-GFP embryo was imaged from 28 to 46 hpf. Three panels spanning 18 min show extrusion of a cell with an obviously fragmented nucleus (arrow). Bar, 5 µm. (C and D) Quantitation of extrusion events in control and hai1a morphants with or without Par2b or matriptase (st14a) deficiency. The ventral yolk sac of 10 periderm-nuclear-GFP embryos for each condition was imaged from 28 to 46 hpf, and extrusion events were counted and classified by whether the nucleus of the extruding cell was not (C) or was (D) obviously fragmented. Results are expressed as the number of extrusion events as a percentage of the number of cells, usually ∼200, present in the field at the start of the imaging period (mean ± SEM; n = 10). The hai1a morphant and mutant groups in C were different from all other groups by one-way ANOVA and Bonferroni posttest, P < 0.0001. No groups in D were different from control. |
|
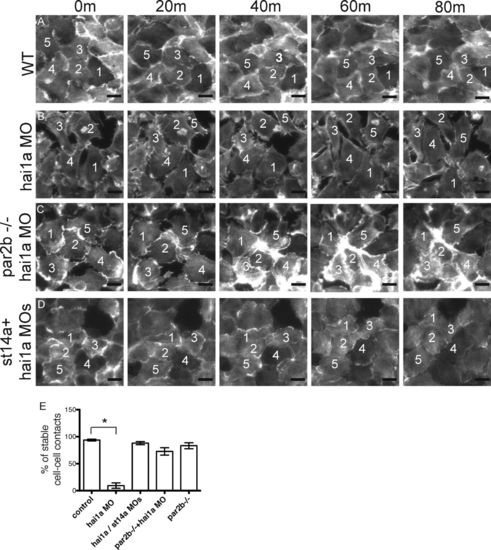
Loss of cell–cell contacts and increased motility of basal layer keratinocytes in hai1a morphants is par2b dependent. (A–D) The yolk sac basal layer of basal-layer-LifeActGFP control or hai1a morphant embryos with or without matriptase or Par2b deficiency was imaged between 24 and 30 hpf. Five panels spanning 80 min (m) are shown. (A) Control embryo. Note tightly apposed basal epithelial cells and stable relative positions of numbered cells. (B) hai1a morphant embryo. Note loss of cell–cell apposition and changing relative cell positions. (C and D) par2b−/− hai1a morphant (C) and st14a/hai1a double morphant (D). Note increased cell apposition and decreased change in position compared with B. Bar, 1 µm. (E) Quantitation of stable cell–cell contacts in control and hai1a morphant basal-layer-LifeActGFP embryos with or without St14a or Par2b deficiency. Time-lapse images of a standard field over the ventral yolk sac were acquired from 24 to 30 hpf for 10 embryos for each condition, and the percentage of individual cells that maintained contact with a neighbor for at least 60 min was determined. Mean ± SEM (n = 10) is shown. Approximately 300 cell–cell contacts were analyzed per condition. The hai1a morphant group was different from controls (*, P < 0.0001), but other groups were not, by one-way ANOVA and Bonferroni posttest. |
|
Altered distribution of nuclei and E-cadherin in basal-layer keratinocytes in hai1a morphants and its par2b-dependence. Control, hai1a morphant, and par2b−/− hai1a morphant periderm-nuclear-GFP embryos were collected at 30 hpf, immunostained for the basal layer marker p63 and E-cadherin, and imaged by confocal fluorescence microscopy. (A) Nuclear-GFP marker of periderm cells. Note regular spacing in controls (left), clustered and crowded appearance in hai1a morphants (middle), and increased number in par2b−/− hai1a morphants (right). (B) p63 marker for basal layer nuclei. Note regular spacing in controls (left), clustered and crowded appearance in hai1a morphants (middle), and more control-like pattern in par2b−/− hai1a morphants (right). (C) E-cadherin staining in basal layer. Note localization to cell–cell junctions in controls (left), aberrant distribution with increased cytosolic staining in areas coinciding with clusters of p63-positive nuclei in hai1a morphants (middle), and more control-like pattern in par2b−/− hai1a morphants (right). Bar, 20 µm. |
|
Effect of Par2b deficiency on increased BrdU incorporation associated with loss of hai1a function in the basal layer versus periderm. (A and B) Control and hai1a morphants periderm-nuclear-EGFP embryos with and without St14a or Par2b deficiency were incubated with BrdU for 3 h beginning at 28 hpf, collected for analysis at 46 hpf, and immunostained for p63 and BrdU. Bar, 50 µm. (B) Colocation of BrdU staining with either nuclear-GFP or nuclear p63 staining was used to identify periderm or basal layer cells that had incorporated BrdU, respectively. (C and D) The percentage of BrdU-positive nuclei in periderm (C) and basal layer (D) is shown (mean ± SEM of three experiments; for each experiment, 10 embryos were examined per condition, and 150–200 cells were analyzed in each embryo). Results were analyzed by one-way ANOVA and Bonferroni posttest. In C, the hai1a/st14a MO group and the par2b−/− hai1a/st14a MO groups were not different from control; the hai1a MO group, the par2b−/− group, and the par2b−/− hai1a MO group were all different from control, and the par2b−/− and hai1a MO groups were different from the par2b−/− hai1a MO group (*, P < 0.05). In D, the hai1a MO group was different from all other groups (*, P < 0.0001). |

ZFIN is incorporating published figure images and captions as part of an ongoing project. Figures from some publications have not yet been curated, or are not available for display because of copyright restrictions. |

ZFIN is incorporating published figure images and captions as part of an ongoing project. Figures from some publications have not yet been curated, or are not available for display because of copyright restrictions. PHENOTYPE:
|


