
- Title
-
Long-Range Signaling Activation and Local Inhibition Separate the Mesoderm and Endoderm Lineages
- Authors
- van Boxtel, A.L., Economou, A.D., Heliot, C., Hill, C.S.
- Source
- Full text @ Dev. Cell

Endoderm Progenitors Arise in an Fgf Ligand-Expressing Domain, but Their Specification Is Inhibited by Fgf Signaling (A) Representative image of a 50% epiboly (5.3 hpf) embryo stained for sox32 by WISH. (B) Sections of three 50% epiboly embryos stained for sox32 by WISH. Dashed line represents the border of the YSL and blastoderm, and arrows indicate sox32-positive endoderm progenitors. Scale bar, 25 μm. (C) Sections of 50% epiboly embryos stained for fgf3 and fgf8a. Note that fgf3 is also expressed in the YSL. Scale bar, 25 μm. (D) Images of 75% epiboly (8 hpf) zebrafish embryos treated with DMSO or PD-0325901 from sphere stage, stained for sox17 by WISH. Arrowhead indicates dorsal forerunner cells to aid comparison of stages. (E) Quantification of sox17-positive cells in embryos as in (D) treated with DMSO (d), SU-5402 (SU), or PD-0325901 (PD). Means ± SD, Mann-Whitney U test; ∗p < 0.05. (F) Quantification of sox17-positive cells at 90% epiboly after treatment with DMSO (d) or PD-0325901 (PD) from sphere (s), 30% epiboly (30), or 50% epiboly (50), corresponding to 4, 4.7, and 5.3 hpf, respectively. Means ± SD, Mann-Whitney U test; ∗p < 0.05. (G) qPCR for indicated genes in dissociated embryonic cells treated with recombinant human NODAL and/or bFGF. Means ±SEM, n = 3, t test; ∗p < 0.05. (H) Double fluorescence in situ hybridization (FISH) for lft2 and sox32 in flat-mounted 50% epiboly embryos treated with DMSO or PD-0325901. White box indicates enlargement in right panel and dotted line marks the boundary between the YSL and margin. (I) Graph of quantification of sox32-positive cells in (H). Means ± SD, Mann-Whitney U test; ∗p < 0.05. Scale bars, 100 μm unless otherwise stated. See also Figure S1. EXPRESSION / LABELING:
PHENOTYPE:
|

Cells Adjacent to the YSL Exhibit Low Levels of P-Erk (A) Z-Projection of the margin of a 50%epiboly embryo stained for P-Erk and P-Smad2. Dashed line indicates the boundary between the YSL and the margin. Scale bar, 50 μm. (B) Quantification of three embryos stained for P-Smad2 as in (A). Depicted is the mean ± SD from a representative experiment (n > 3). (C) As in (B) for P-Erk. (D) Animal views of WISH-stained 50% epiboly embryos for noto, treated with the Fgf signaling inhibitor (SU-5402) or the Nodal signaling inhibitor (SB-505124). Note that the inhibition of noto expression by SB-505124 reflects the regulation of Fgf by Nodal. Scale bar, 100 μm. (E) Quantification of unsaturated FISH-stained embryos for lft2 and noto at 50% epiboly. For each trace n = 3, means are shown by the lines, and the shading indicates the SD. (F) As in (E), but for lft2 and ta. (G) Sections of unsaturated WISH-stained embryos for lft2, ta, and noto. Arrows indicate cells with low levels of expression and dashed line marks the border of the YSL. Scale bar, 25 μm. (H) Schematic representation of gene expression in the margin. (I) Time course of weighted means of P-Erk staining intensities, normalized to DAPI in the margin from 4 hpf (sphere stage) to 5 hpf (40% epiboly). (J) As in (I), but for P-Smad2. See also Figure S2. EXPRESSION / LABELING:
PHENOTYPE:
|
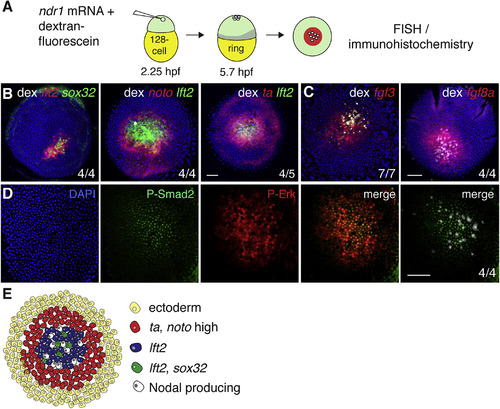
Ectopic Nodal-Induced Patterning at the Animal Pole Mimics Patterning at the Margin (A) Schematic of generation of Ndr1-expressing clones. Single blastomeres are injected at the 128-cell stage (2.25 hpf), fixed at germ ring stage (5.7 hpf) and stained using FISH or immunohistochemistry. (B) Animal views of germ ring-stage embryos containing Ndr1-expressing clones marked with dextran-fluorescein (dex) and stained for indicated markers. (C) As in (B), but for fgf3 and fgf8a. (D) Germ ring-stage embryos containing Ndr1-expressing clones, stained by immunohistochemistry for P-Erk and P-Smad2. Single panels are shown and a merge. The merge on the far right shows the Ndr1-expressing cells labeled with dex (white) with staining for P-Smad2 (green). (E) Schematic representation of gene expression in surrounding Ndr1-expressing clones. Scale bars, 100 μm. See also Figure S3. |
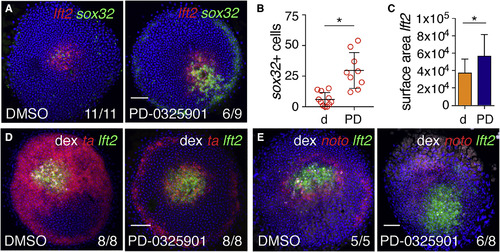
Fgf Signaling Represses Endoderm Specification around Ndr1 Clones (A) Animal views of DMSO- and PD-0325901-treated germ ring-stage embryos containing Ndr1-expressing clones stained for lft2 and sox32. (B) Quantification of sox32-positive cells in (A). Means ± SD, Mann-Whitney U test; ∗p < 0.05. (C) Quantification of surface area of lft2-positive domain surrounding Ndr1-expressing clones in embryos treated as in (A). n = 3, 11 embryos in total. Means ± SD, two-tailed t test; ∗p < 0.05. (D) Animal views of germ ring-stage embryos treated as in (A), but stained for ta and lft2. (E) Animal views of germ ring-stage embryos treated as in (A), but stained for noto and lft2. Scale bars, 100 μm. See also Figure S4. |
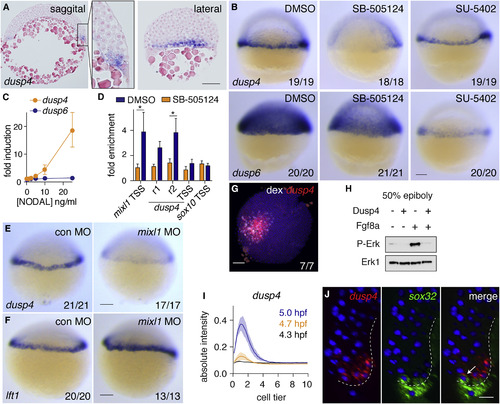
Zebrafish Dusp4 Is a Direct Nodal Target, Expressed in the First Two Cell Tiers, that Dephosphorylates Erk (A) Sagittal and lateral sections of 50% epiboly embryo WISH-stained for dusp4. (B) WISH at 50% epiboly for dusp4 and dusp6 after Nodal signaling inhibition (SB-505124) or Fgf signaling inhibition (SU-5402). (C) qPCR using dissociated embryonic cells treated with increasing NODAL concentrations. Means ± SEM, n = 5. (D) Chromatin immunoprecipitation for Smad2 on putative enhancers of the dusp4 gene (r1 and r2) and the dusp4 transcription start site (TSS) in 50% epiboly embryos treated with DMSO or the Nodal receptor inhibitor SB-505124. The mixl1 TSS and sox10 TSS are positive and negative controls respectively. Means ± SEM, n = 4, ∗p < 0.05, t test. (E and F) 50% epiboly zebrafish embryos injected with control MO (con MO) or mixl1 MO, stained for dusp4 (E) or lft1 (F) by WISH. (G) Animal view of germ ring-stage embryo containing Ndr1-expressing clone, marked with dextran-fluorescein (dex) and stained for dusp4. (H) Western blot showing attenuation of Fgf8a-induced P-Erk by Dusp4 at 50% epiboly. (I) Quantification of embryos stained by FISH for dusp4 at 4.3 (dome), 4.7, and 5.0 hpf. For each time point n = 3, means are shown by the lines and the shading indicates the SD. (J) A confocal Z-reconstruction of a 50% epiboly embryo stained for dusp4 and sox32. Nuclei are marked by DAPI. Arrow indicates a cell in the blastoderm labeled with both dusp4 and sox32. Dashed white line indicates the border of the YSL. Scale bar, 25 μm. Scale bars, 100 μm unless otherwise stated. See also Figure S5. EXPRESSION / LABELING:
PHENOTYPE:
|
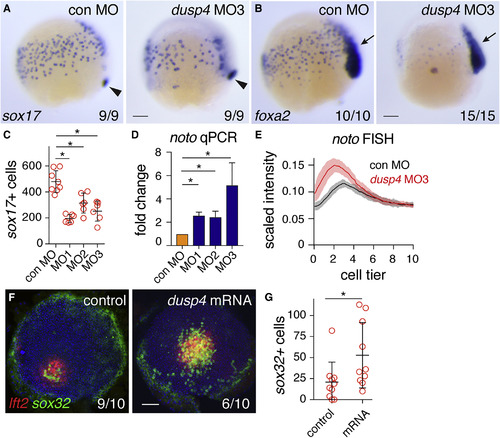
Dusp4-Mediated Repression of Fgf Signaling Is Required for Endoderm Specification (A) Representative images of 75% epiboly zebrafish embryos injected with control MO (con MO) or dusp4 MO3, stained for sox17 by WISH. Arrowhead indicates dorsal forerunner cells for comparison of staging. (B) As in (A), but stained for foxa2. Arrow, foxa2 expression in axial mesoderm. (C) Quantification of endodermal progenitors in 75% epiboly embryos, injected with indicated dusp4 MOs. Means ± SD, Mann-Whitney U test; ∗p < 0.05. (D) qPCR on 50% epiboly embryos injected with control MO or dusp4 MOs. Means ± SEM, n ≥ 2, t test; ∗p < 0.05. (E) Traces of noto expression detected with FISH in 50% epiboly zebrafish embryos injected with control MO or dusp4 MO3. For each condition, n = 3. Means are shown by the lines and the shading indicates the SD. (F) Animal views of germ ring-stage embryos, control-injected or injected with dusp4 mRNA, containing Ndr1-expressing clone and stained for lft2 and sox32. (G) Quantification of sox32-positive cells as in (F). Means ± SD, Mann-Whitney U test; ∗p < 0.05. Scale bars, 100 μm. See also Figure S6. EXPRESSION / LABELING:
PHENOTYPE:
|
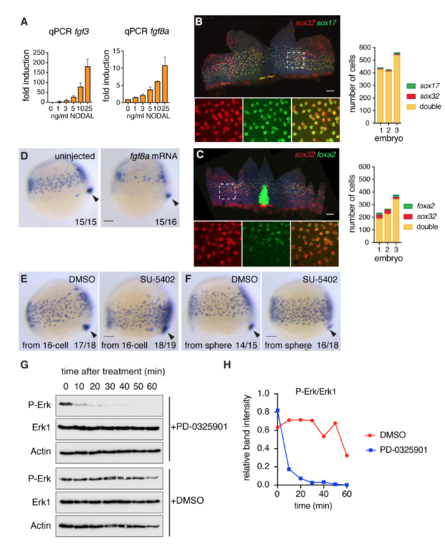
Fgf signaling inhibits endoderm specification (A) qPCR for fgf3 and fgf8a in zebrafish dissociated embryos treated with increasing concentrations of NODAL, mean ± SEM, n >3. (B) Left panel: Flat-mounted 80% epiboly embryo stained for sox32 and sox17. Box with dashed white line indicates the enlarged area presented in the bottom panels where the staining is shown for the individual genes and the two combined. Right panel: quantification of endoderm progenitors from three embryos stained as in left panel. (C) As in (B) but for sox32 and foxa2 in 70% epiboly embryos. The strong foxa2 staining in the center of the flat-mount image corresponds to the foxa2 expressing axial mesoderm. (D) Representative images of either uninjected or fgf8a mRNA-injected embryos (10 pg) isolated at 75% epiboly and stained for sox17 by WISH. Overexpression of fgf8a results in reduced endodermal cell numbers. Arrowhead, dorsal forerunner cells, which mark the most posterior end of the embryo to compare staging. (E) Representative images of 75% epiboly embryos stained for sox17 by WISH after treatment with either DMSO as control or 10 μM SU-5402. Chemicals were added from the 16-cell stage. Arrowhead, dorsal forerunner cells. Note that as well as increasing sox17-positive endoderm progenitors, SU-5402 also partially inhibits cell migration. (F) Same as in (E) but for embryos treated from sphere stage. Note that Fgf signaling inhibition in (E) and (F) both result in more endodermal progenitors. (G) 50% epiboly embryos were treated with DMSO or PD-0325901 for the times shown. Whole cell extracts were Western blotted for P-Erk, Erk1 and Actin as a loading control. (H) The Western blots in (G) were scanned and quantitated using ImageJ. All scale bars are 100 μm. |
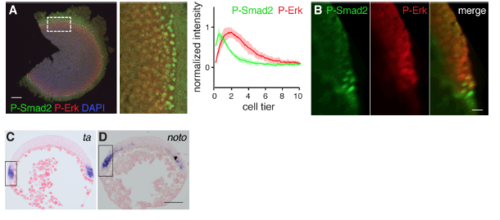
Cells directly adjacent to the YSL maintain low levels of P-Erk (A) Example of flat-mounted, 50% epiboly embryo, stained by immunohistochemistry for PErk and P-Smad2. Right panel shows average of intensity traces of three embryos (mean ± SD). Scale bar, 100 μm. (B) Resliced optical section of 50% epiboly embryo stained as in (A) obtained with light sheet microscope. Note that nuclei close to the YSL have high P-Smad2, but low P-Erk levels. Scale bar, 25 μm. (C) Section of paraffin embedded WISH-stained 50% embryo for ta. Dorsal to the right. Box indicates enlarged area in Figure 2G. Scale bar, 100 μm. (D) As in (C) for noto, except that dorsal is to the left. |

Nodal-induced patterning in the animal pole mimics patterning in the margin. (A) Flat-mounted germ ring stage embryos containing a Nodal-expressing clone stained for sox32 and lft2. This is the same embryo shown in Figure 3B left panel, but here the individual channels are shown. The Nodal-expressing clones are visualized with the dextran fluorescein (dex), and nuclei are visualized with DAPI. A merge of all channels is also shown. Note that sox32-positive cells are specified within the lft2-positive domain. In the bottom right corner, the number of representative embryos is depicted out of total analyzed embryos from two independent experiments. (B) As in (A) but for lft2 and noto. noto expression is lower in the lft2 expressing domain. This is the same embryo shown in Figure 3B, middle panel. (C) As in (A) but for lft2 and ta. Expression of ta is lower within the lft2 expressing domain. This is the same embryo shown in Figure 3B, right panel. (D) As in (A) but for lft2 and fgf3. This is the same embryo shown in Figure 3C, left panel. (E) As in (A) but for lft2 and fgf8a. This is the same embryo shown in Figure 3C, right panel. (F and G) Examples of Nodal-expressing clones visualized with dextran fluorescein (dex) and stained for P-Erk. In very dense clones (3/21) it is clear that the cells expressing Nodal show a clear domain of low P-Erk staining (F). In other clones (18/21), the P-Erk staining is heterogeneous throughout (G). All scale bars are 100 μm. |
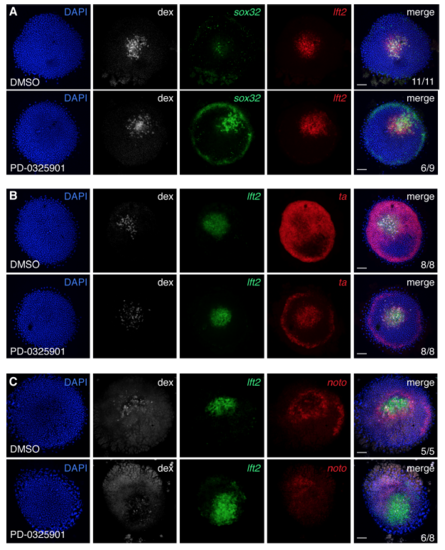
Inhibition of P-Erk signaling promotes the formation of sox32-positive cells in Nodal-expressing clones (A) Flat-mounted germ ring stage embryos containing a Nodal-expressing clone treated with DMSO or MEK inhibitor PD-0325901 and stained for sox32 and lft2. These are the same embryos as in Figure 4A, except that here individual channels are shown. The number of sox32- positive cells is strongly increased in the PD-0325901-treated embryo. (B) As in (A), but for lft2 and ta. These are the same embryos as in Figure 4D. (C) As in (A), but for lft2 and noto. These are the same embryos as in Figure 4E. In (B) and (C), incubation with PD-0325901 inhibits expression of ta and noto around the clone, confirming that this expression is due to Fgf signaling. All scale bars are 100 μm. |
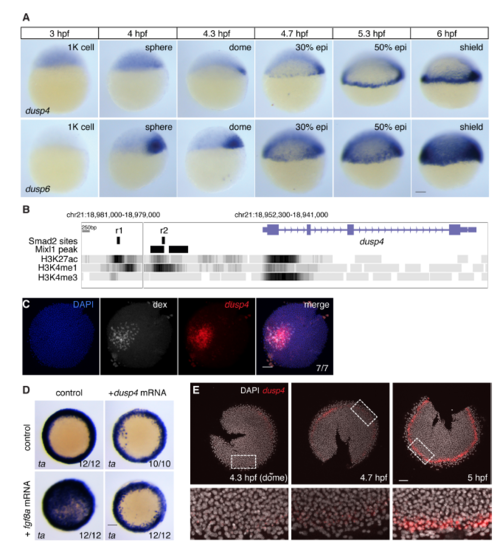
Zebrafish dusp4 is expressed in the first two cell tiers and dephosphorylates Erk (A) WISH for dusp4 and dusp6 expression in 1000-cell (1K) to shield stage embryos. Both dusp4 and dusp6 are initially transiently expressed in a dorsal domain, but from 30% epiboly start to be expressed in the ventral and lateral margin. dusp4 expression remains confined up to the first cell tiers whereas dusp6 is expressed in a much larger domain. The hours post fertilization (hpf) are indicated above. (B) The dusp4 locus from the UCSC genome browser (Zv9) showing the H3K27ac, H3K4me1 and H3K4me3 tracks. The positions of the putative enhancers r1 and r2 are shown, as is the position of the Mixl1 peaks taken from data reported in Nelson et al., 2017. (C) FISH for dusp4 mRNA surrounding Nodal-expressing clone marked with dextran fluorescein (dex). This is the same embryo shown in Figure 5G. (D) WISH for ta after fgf8a and/or dusp4 mRNA injection. Embryos are from the same experiment as the Western blot in Figure 5H. (E) FISH for dusp4 in flat-mounted embryos fixed at the times indicated to show how expression is induced over time from dome stage (4.3 hpf). Note that staining is seen in 2–3 cell tiers from the YSL at the 5 hpf. These are representative embryos from those used to calculate the traces in Figure 5I. All scale bars are 100 μm. |
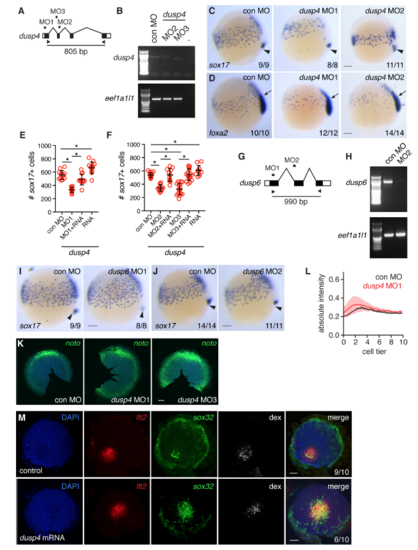
dusp4, but not dusp6 loss-of-function, reduces endoderm specification (A) Schematic representation of knockdown strategy for dusp4 using three non-overlapping MOs (MO1–3). (B) For MO2 and MO3, RT-PCR was performed using the indicated oligonucleotides shown in (A) to generate an 805 bp band. The housekeeping gene eef1a1l1 was used as a control. Note that both splice blocking MOs result in loss of the 805 bp band. (C) WISH for sox17 on 75% epiboly embryos after injection with MO1 and MO2. Arrowhead, dorsal forerunner cells. (D) As in (C) for foxa2. Note reduction of both foxa2 and sox17 with dusp4 knockdown, reflecting reduction of the entire endodermal cell population (see also Figure S1B,C). Arrow, foxa2 expression in the axial mesoderm. (E) Quantification of endodermal cell numbers at 75% epiboly in embryos injected with control MO (con MO), dusp4 MO1 ± 400 pg dusp4 mRNA containing 5 silent mutations in the MO1 binding site, or with the mutated dusp4 mRNA alone. (Means ± SD, * Mann-Whitney U test, p < 0.05) The MO1 phenotype is partially rescued with the mRNA. (F) Quantification of endodermal cell numbers at 75% epiboly in embryos injected with control MO (con MO), dusp4 MO2 or MO3 ± 400 pg dusp4 mRNA, or with the dusp4 mRNA alone. (Means ± SD, * Mann-Whitney U test, p < 0.05) The morphant phenotype is partially rescued with the mRNA. (G) Schematic representation of knockdown strategy for dusp6 using two non-overlapping MOs (MO1 and MO2). (H) RT-PCR for dusp6 after knock down with MO2. (I) WISH for sox17 with dusp6 MO1 at 75% epiboly. (J) As in (I) but using dusp6 MO2. Neither of the dusp6 MOs showed any effect on endodermal cell numbers. In (I) and (J), arrowhead marks dorsal forerunner cells. (K) Flat-mounted 50% epiboly embryos stained for noto after knockdown of dusp4. (L) Quantification of noto profile after injection with dusp4 MO1 compared to control MO. For each condition, n=3, means are shown by the lines and the shading indicates the SD. (M) Flat-mounted germ ring stage embryos containing a Nodal clone that were either control injected or injected with dusp4 mRNA and stained for sox32 and lft2. These are the same embryos as shown in Figure 6F, but here individual channels are shown. All scale bars are 100 μm. |
Reprinted from Developmental Cell, 44(2), van Boxtel, A.L., Economou, A.D., Heliot, C., Hill, C.S., Long-Range Signaling Activation and Local Inhibition Separate the Mesoderm and Endoderm Lineages, 179-191.e5, Copyright (2017) with permission from Elsevier. Full text @ Dev. Cell