- Title
-
Mis-expression of grainyhead-like transcription factors in zebrafish leads to defects in enveloping layer (EVL) integrity, cellular morphogenesis and axial extension
- Authors
- Miles, L.B., Darido, C., Kaslin, J., Heath, J.K., Jane, S.M., Dworkin, S.
- Source
- Full text @ Sci. Rep.
|
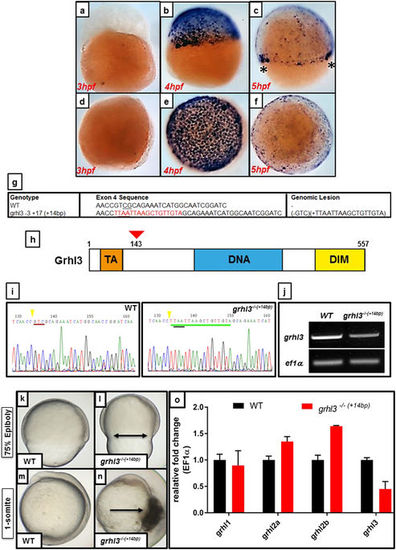
CRISPR-Cas9 mediated generation of a grhl3 deletion zebrafish model. (a–f) ISH expression of grhl3 at 3–5 hpf, shown in lateral (a–c) and dorsal (d–f) views. grhl3 is not maternally deposited (a,d), but is strongly and specifically expressed within all EVL cells at ~4 hpf, corresponding temporally to the maternal-zygotic transition (MZT; b–e). grhl3 mRNA is rapidly downregulated, remaining primarily localised at the leading-edge margins (asterisk, c). (g) Sequence details of the exon 4 region of grhl3, showing a loss of 3 bp and insertion of a STOP codon cassette comprising 17 bases, resulting in a net gain (genomic lesion) of 14 bp in the grhl3 mutant. (h) Schematic of the zebrafish grhl3 protein (to scale; amino acids 1–557), showing trans-activation (TA), DNA-binding (DNA), and dimerisation (DIM) domains, indicating site of genomic lesion at codon 143. (i) Sequencing of WT and grhl3 −/−(+14bp) embryos confirming presence of the genomic lesion. The red underline indicates (in WT) the position of the three deleted nucleotides, green underline shows insertion of 17 bp of STOP-cassette, black underline shows the resultant in-frame stop codon, yellow arrowhead indicates the CRISPR/Cas9-cut site. (j) RT-PCR showing ~50% loss of grhl3 transcript in grhl3 −/−(+14bp) embryos relative to controls at 8 hpf; a full-length gel photo is presented in Supplementary Figure S8. (k–l) Epiboly is delayed in grhl3 −/−(+14bp) embryos (l) relative to WT (k), resulting in premature contraction of the leading-edge actin ring (arrows in L) at ~75% epiboly. (m,n) WT embryo at the onset of somitogenesis showing normal development (m), and grhl3 −/−(+14bp) embryo (n) showing rupture of the EVL resulting in lethality (arrow in n). (O) Q-RT-PCR showing decreased grhl3 expression, no change in grhl2a, and slightly elevated expression of grhl2b at ~75% epiboly in grhl3 −/−(+14bp) embryos relative to WT controls. EXPRESSION / LABELING:
PHENOTYPE:
|
|
Midbrain-Hindbrain Boundary (MHB) morphogenesis is disrupted following knockdown of grhl3-dependent transcriptional networks. (a,b) Axial length is reduced, neural morphology is disrupted, and fish often exhibit a “curved-tail” phenotype (inset; 96 hpf) in MO:grhl3 injected fish relative to controls. (c,d) The MHB defect in MO:grhl3 injected fish presents as aberrant folding (dorsal view), confirmed by horizontal sections of H&E stained MHB tissue (c,d; inset). (e,f) Although the MHB is mis-folded, MHB patterning markers (such as eng2a) are not differentially regulated. (g–j) Following sub-phenotypic co-knockdown of grhl3 and spec1 (MO:grhl3 + MO:spec1; g,i) the MHB is mis-folded when compared to phenotypically normal MO:spec1 + MO:control injected fish (h,j). (k–p) Following sub-phenotypic co-knockdown of grhl3 and arhgef19 (MO:grhl3 + MO:arhgef19; k), the fish are slightly shorter relative to phenotypically normal MO:arhgef19 + MO:control injected fish (l). Furthermore, the neural tube exhibits an “open” phenotype at the MHB region (dorsal view; m,n); this is highlighted by ISH for the MHB marker eng2a (posterior view of MHB; o). relative to the phenotypically normal MHB seen in MO:grhl3 + MO:control injected fish (p). |
|
EVL cell size and identity is aberrant in MO:grhl3 and MO:arhgef19 injected zebrafish. (a–g) Rhodamine-phalloidin staining of F-actin in 24 hpf embryos injected with either MO:grhl3 + MO:arhgef19 MO:control (a,b) or MO:control (d,e) shows that periderm cells with abrogated grhl3/arhgef19 signalling are larger (boxed region in b,e). Morphometric quantitation of cell size using FiJi software (c,f) shows significant disparity in cell size in MO:grhl3 + MO: arhgef19 injected embryos (as well as singly-injected MO:grhl3 and MO: arhgef19 embryos), relative to controls (G). (h–o) The basal keratinocyte marker fibronectin (i) is ectopically expressed in EVL cells surrounding the MHB in MO:grhl3-injected embryos (merged image; j). Conversely, EVL cells (k) do not express fibronectin (l) in MO:control fish (merged image, m). Digital cross-section confirms that several dorso-ventral layers of fibronectin positive cells are present in MO:grhl3-injected fish (n), whereas fibronectin positive cells are distributed within a single, one-cell thick layer MO:control injected fish (o). PHENOTYPE:
|
|
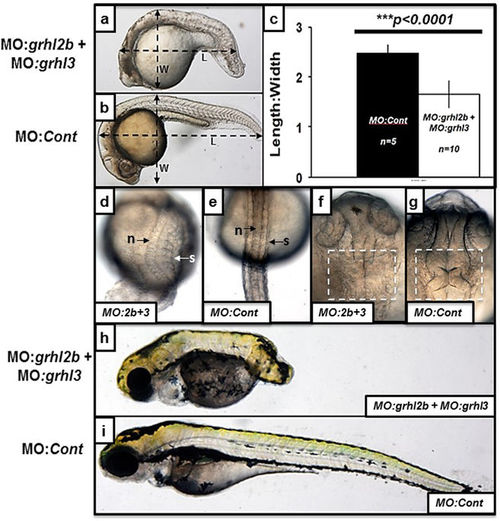
grhl2b/grhl3 double morphants present with phenotypes highly consistent with disrupted convergence-extension mediated migration, as well as MHB folding defects. (a–i) MO:grhl2b + MO:grhl3 injected double morphants (a) display a reduced axial length and decreased length:width ratio (LWR) relative to embryos injected with MO:control (b). These differences were quantitated (c), showing significantly decreased LWR in MO:grhl2b + MO:grhl3 injected double morphants (p < 0.0001 by Student’s T-test). (d–g) Dorsal views of MO:grhl2b + MO:grhl3 double morphants (d,f) relative to MO:control embryos (e,g) at 24 hpf highlighting the thicker trunk, broadened notochord (n) and splayed somites (s) characteristic of embryos with disrupted convergence-extension; as well as disruption of MHB morphogenesis (compare f with g). (h–i) MO:grhl2b + MO:grhl3 double morphants (f) relative to MO:control embryos at 96 hpf, highlighting severely reduced axial extension. |
|
Over-expression of both grhl3 and grhl2b results in defective patterning and cellular migration. (a–g) Over-expression of grhl3 results in three disparate phenotypes, notably a failure to extend axis (FTEA; a), dorsalisation (b), or mid-axial duplication (c). ISH showing duplication or bifurcation of the neural tube (shh; d), somites (myoD; E), MHB (eng2a, f) and hindbrain rhombomeres (krox20; g) (h–m) Over-expression of grhl2b mRNA (lateral view H; ventral view, i) results in cyclopia, a defect not seen following injection of control (LacZ) mRNA (lateral view J; ventral view, k). This defect is likely due to impaired anterior neural tube extension in embryos over-expressing grhl2b mRNA, as shown by expression of the neural tube marker shh (arrow) by ISH (l–m). |
|
The expression of Midbrain-Hindbrain Boundary (MHB) patterning marker genes is unchanged in MO:grhl3 injected fish. The expression profile of MHB patterning marker genes eng2a, her5, pax2a and wnt1 is largely unchanged in MO:grhl3 injected embryos relative to MO:control injected embryos at all stages of MHB development examined – 9-10 hpf; 18 hpf and 24 hpf. |
|
Expression patterns of grhl3 and arhgef19 in early zebrafish development. (A-F) grhl3 is expressed within the pharyngeal endoderm (PE) from 10 hpf (A), a timepoint at which expression within the EVL is also visible. Expression within both these regions persists until at least 18 hpf (B-C). grhl3 expression is not seen in brain; non-specific probe trapping (C) is confirmed as artefact following both brightfield imaging of coronal sections (D) and subsequent H&E staining of both coronal (E) and sagittal (F) sections. Note persistent expression of grhl3 within the PE (D-F) and occasional puncta of staining within the EVL (F). (G-H) Expression of arhgef19 is seen in the EVL, lateral to the MHB (arrows, G), as well as in the EVL at the posterior-most region of the extending tail (arrow, H) at 24 hpf. (I) Q-RT-PCR showing expected non-significant decrease in arhgef19 and spec1 transcripts in MO:grhl3 injected embryos. |
|
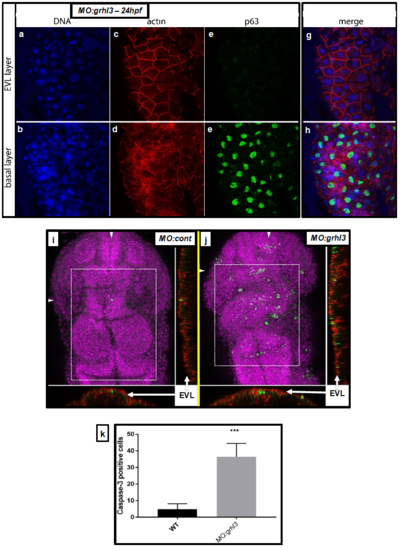
Characterisation of cell identity and viability in the EVL and basal layers of MO:grhl3 injected fish. (A-H) DAPI staining showing no loss of nuclei in either EVL or basal layers (A-B). Rhodamine-Phalloidin staining showing normal distribution of F-actin in the EVL (C) and basal layer (D). There are no ectopic basal keratinocytes (p63+) present in the EVL (E), although, as expected, these are abundant in the basal layer (F; merged views G-H). (I-K) Activated Caspase-3 immunohistochemistry reveals few apoptotic cells in control fish (I) relative to the significantly increased numbers of apoptotic cells seen in MO:grhl3 injected embryos (J) at the level of the midbrain and hindbrain (boxed region in I-J); orthogonal views at the levels indicated (arrowheads; I-J) confirm that the majority of apoptotic cells are seen in the EVL and adjoining dorsal-most neural tissue, but are largely absent from the deeper neural tissue. These data are quantitated from n=4 controls and n=3 MO:grhl3-injected embryos (K). |
|
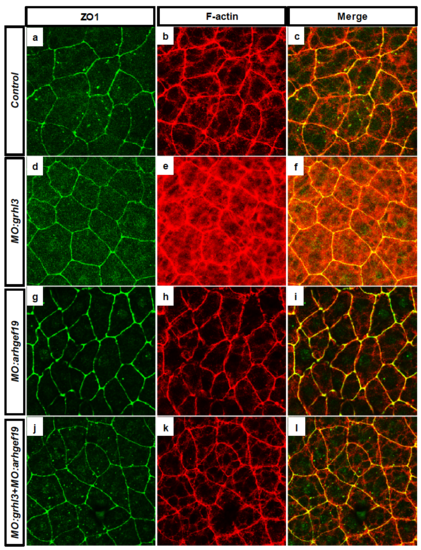
Characterisation of tight junction formation following knockdown of grhl3 and arhgef19 at 8 hpf. (A-C) The expression of ZO1 (A) and actin (B) in the EVL (C; merged) of WT fish is unchanged following MO-mediated knockdown of grhl3 (D-F), arhgef19 (G-I) or both grhl3 and arhgef19 together (J-L) at 8 hpf. |
|
Characterisation of tight junction formation following knockdown of grhl3 and arhgef19 at 24 hpf. (A-C) The expression of ZO1 (A) and actin (B) in the EVL (C; merged) of WT fish overlying the region of the midbrain-hindbrain boundary (MHB) is unchanged following MO-mediated knockdown of grhl3 (D-F), arhgef19 (G-I) or both grhl3 and arhgef19 together (J-L) at 24hpf. Note increased EVL cell size in both MO:grhl3 (D-F) and MO:grhl3+MO:arhgef19 (J-L) injected embryos. |
|
Characterisation of epithelial integrity marker and grhl-target gene E-cadherin following modulation of grhl3 and arhgef19 activity at 24 hpf. (A-C) The expression of E-cadherin (A) and actin (B) in the EVL (C; merged) of WT fish overlying the region of the midbrain-hindbrain boundary (MHB) is unchanged following MO-mediated knockdown of grhl3 (D-F), arhgef19 (G-I), both grhl3 and arhgef19 together (J-L), or over-expression of grhl3 mRNA (M-O) at 24 hpf. Note increased EVL cell size in both MO:grhl3 (D-F) and MO:grhl3+MO:arhgef19 (J-L) injected embryos. Nuclei in merged panels (C, F, I, L, O) are shown by DAPI staining. |


