- Title
-
CRISPR-Cpf1 mediates efficient homology-directed repair and temperature-controlled genome editing
- Authors
- Moreno-Mateos, M.A., Fernandez, J.P., Rouet, R., Vejnar, C.E., Lane, M.A., Mis, E., Khokha, M.K., Doudna, J.A., Giraldez, A.J.
- Source
- Full text @ Nat. Commun.
|
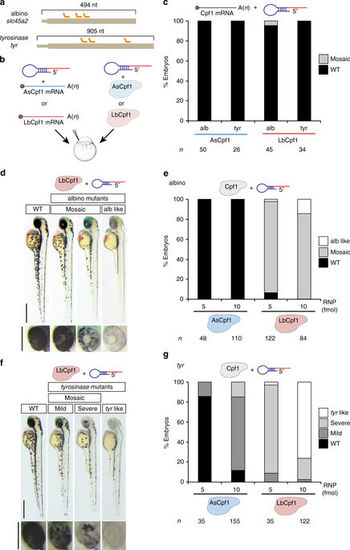
LbCpf1–crRNA RNP complexes are a robust genome editing system in zebrafish. a Diagram illustrating three crRNAs (orange) targeting slc45a2 and tyr exon 1 in zebrafish. b Schematic illustrating the experimental set-up to analyze CRISPR-Cpf1-mediated mutations in zebrafish. Three crRNAs (a) were either mixed with mRNA coding for AsCpf1 or LbCpf1 or assembled into RNP complexes with their corresponding purified proteins and injected in one-cell-stage embryos. c Phenotypic evaluation of crRNAs (30 pg/crRNA) and mRNA (100 pg) injections. Stacked barplots showing the percentage of mosaic (gray) and phenotypically wild-type (WT; black) embryos 48 h post fertilization (hpf) after injection. d Phenotypes obtained after the injection of the LbCpf1–crRNA RNP complexes targeting slc45a2 showing different levels of mosaicism compared to the WT. Lateral views (scale bar, 0.5 mm) and insets of the eyes (scale bar, 0.25 mm) of 48 hpf embryos are shown. e Phenotypic evaluation of Cpf1–crRNA RNP complexes injections targeting slc45a2 (albino). Stacked barplots showing the percentage of alb-like (white), mosaic (gray), and phenotypically WT (black) embryos 48 hpf after injection using different amounts (fmol) of RNP complexes. Number of embryos evaluated (n) is shown for each condition. f Phenotypes obtained after the injection of the LbCpf1–crRNA RNP complexes targeting tyr showing different levels of mosaicism compared to the WT. Lateral views (scale bar, 0.5 mm) and insets of the eyes (scale bar, 0.25 mm) of 48 hpf embryos are shown. g Phenotypic evaluation of Cpf1–crRNA RNP complexes targeting tyrosinase (tyr). Stacked barplots showing the percentage of tyr-like (white), severe mutant (light gray), mild mutant (dark gray), and phenotypically WT (black) embryos 48 hpf after injection using different amounts (fmol) of RNP complexes. Number of embryos evaluated (n) is shown for each condition |
|
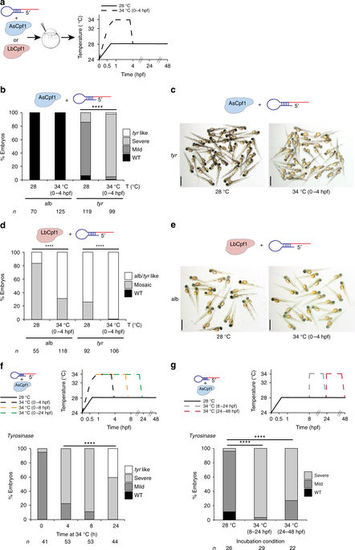
Temperature is a key factor modulating Cpf1 activity in vitro and in vivo. a Schema illustrating different temperature incubations after Cpf1–crRNA RNP complex injections targeting slc45a2 (alb) and tyr. b Phenotypic evaluation of AsCpf1–crRNA RNP complex (10 fmol) injections at different temperature incubations (T). Stacked barplots showing the percentage of tyr-like (white), severe mutant (light gray), mild mutant (dark gray), and phenotypically WT (black) embryos 48 hpf after injection. Number of embryos evaluated (n) is shown for each condition. χ 2-test (****p < 0.0001). c A representative picture showing 48-hpf-old embryos obtained after AsCpf1–crRNA RNP complex injections targeting tyr at different temperature incubations. Scale bar, 1.25 mm. d Phenotypic evaluation of LbCpf1–crRNA RNP complex (10 fmol) injections at different temperature incubations (T). Stacked barplots showing the percentage of alb/tyr-like (white), mosaic mutants (gray), and phenotypically WT (black) embryos 48 hpf after injection. Number of embryos evaluated (n) is shown for each condition. χ 2-test (****p < 0.0001). e A representative picture showing 48-hpf-old embryos obtained after LbCpf1–crRNA RNP complex injections targeting slc45a2 at different temperature incubations. Scale bar, 1.25 mm. f Schematic illustrating different incubation conditions (0, 4, 8, or 24 h at 34 °C, then at 28 °C) after AsCpf1–crRNA RNP complex (10 fmol) injections targeting tyr in zebrafish (top). Phenotypic evaluation of AsCpf1–crRNA RNP complex injections targeting tyr in the conditions described above (bottom). Stacked barplots showing the percentage of tyr-like (white), severe mutant (light gray), mild mutant (dark gray), and phenotypically WT (black) embryos 48 hpf after injection. Number of embryos evaluated (n) is shown for each condition. χ 2-test (****p < 0.0001). g Schematic illustrating different incubation conditions: 8 h at 28 °C, 16 h at 34 °C, and then 24 h at 28 °C (34 °C 8–24 hpf) or 24 h at 28 °C, then 24 h at 34 °C (34 °C 24–48 hpf) after AsCpf1–crRNA RNP complex (10 fmol) injections targeting tyr in zebrafish (top). Phenotypic evaluation of AsCpf1–crRNA RNP complex injections targeting tyr in the conditions described above (bottom). Stacked barplots showing the percentage of severe mutant (light gray), mild mutant (dark gray), and phenotypically WT (black) embryos 48 hpf after injection. Number of embryos evaluated (n) is shown for each condition. χ 2-test (****p < 0.0001) |
|
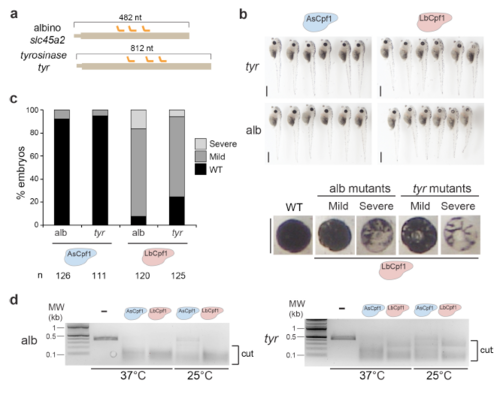
LbCpf1-crRNA RNP complexes are an efficient genome editing system in X. tropicalis. a. Diagram illustrating 3 crRNAs (orange) targeting slc45a2 and tyr exon 1 in X. tropicalis. b. Phenotypes obtained after injection of the AsCpf1-crRNA or LbCpf1-crRNA RNP complexes (20 fmol) containing a mix of 3 crRNAs targeting slc45a2 (alb) or tyr in X. tropicalis. Lateral views (top; scale bar, 1 mm) and insets of the eyes (bottom; scale bar, 0.4 mm) of stage 47–48 embryos are shown. c. Phenotypic evaluation of Cpf1-crRNA RNP complexes (20 fmol) injections targeting slc45a2 (alb) or tyr in X. tropicalis. Stacked barplots showing the percentage of severe mutant (light gray), mild mutant (dark grey) and phenotypically WT (black) embryos at stage 47-48. Number of embryos evaluated (n) is shown for each condition. d. In vitro cleavage assay using 30 pmol of AsCpf1 RNP or LbCpf1 RNP complexes containing a mix of 3 crRNAs (Supplementary Fig. 5a) and a ~380pb (~ 0.45 pmol) or ~440pb (~ 0.38 pmol) PCR product including crRNA target sites for slc45a2 (alb) (left) and tyr (right), respectively. Incubations were carried out at 37°C and 25°C for 90 min. MW: Molecular weight marker (kilobase). |
|
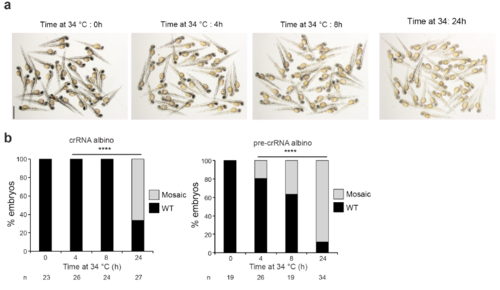
Longer incubations at 34°C improve AsCpf1 activity in vivo. a. A representative picture showing 48 hpf old embryos obtained after AsCpf1-crRNA RNP complexes injections targeting tyr in the conditions described in Fig. 2f. Scale bar, 1.25 mm. b. Phenotypic evaluation of AsCpf1-crRNA (left) or AsCpf1-pre-crRNA (right) RNP complexes (10 fmol) injections targeting slc45a2 (alb) in the conditions described in Fig. 2f. Stacked barplots showing the percentage of mosaic mutants (grey), and phenotypically WT (black) embryos 48 hpf after injection. Number of embryos evaluated (n) is shown for each condition. χ2 test (****p< 0.0001). |
|
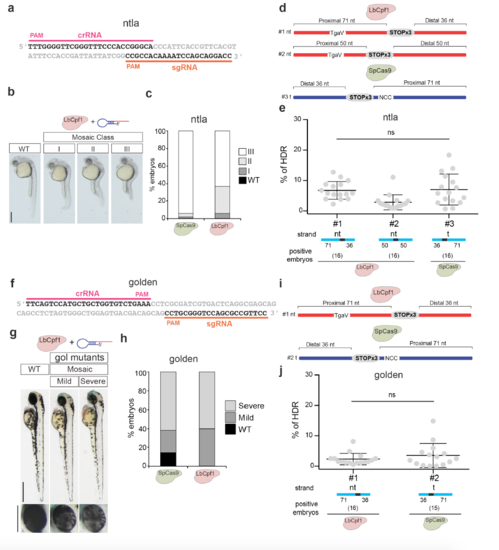
LbCpf1-mediated homology-directed repair in ntla and golden loci. a. crRNA (pink line) and sgRNA (orange line) target sequences in the ta (ntla) locus used for this analysis. b. Phenotypes obtained after injection of the LbCpf1-crRNA and SpCas9-sgRNA RNP complexes (10 fmol) targeting ntla in zebrafish embryos (Lateral views). Levels of mosaicism compared to wild type (WT) were evaluated at 30 hpf. Class I: Short tail (least extreme). Class II: Absence of notochord and short tail (medium level). Class III: Absence of notochord and extremely short tail (most extreme). Scale bar, 0.36 mm. c. Stacked barplots showing the percentage of different mosaic mutants described in b. d. Schema illustrating different donor ssDNA (#1-#2) complementary to the target strand (t) and with symmetric or asymmetric homology arms used in combination with LbCpf1-crRNA. PAM sequence was modified (TgaV/ActB) to prevent new editing post-HDR. An optimized ssDNA donor (#3) described for SpCas9-induced HDR8 was used in combination with SpCas9-sgRNA RNP as reference for comparison (bottom). e. qPCR quantification showing percentage of HDR from individual embryos when using LbCpf1 and different ssDNA donors in comparison with SpCas9 in the conditions described in d. To measure % HDR, specific primers to amplify DNA integrations were used following a similar approach described in Supplementary Fig. 10b and h, and albino genomic primers were used to estimate genomic DNA amount (Supplementary Data 1, see Methods). % of HDR: amount of integrated DNA per total amount of genomic DNA per embryo (see methods for details). Results are shown as the averages ± standard deviation of the means from 16 embryos in two independent experiments (n=8 embryos per experiment). Embryos showing a PCR amplification signal detectable by qPCR were considered positive. The data were analyzed by Kruskal-Wallis test followed by Dunn’s post-test for significance versus control condition (#3). No significant (ns) differences were found between LbCpf1 and SpCas9 in the optimized conditions (#1 vs #3). f. crRNA (pink line) and sgRNA (orange line) target sequences in the slc24a5 (golden) locus used for this analysis. g. Phenotypes obtained after injection of the LbCpf1-crRNA and SpCas9-sgRNA RNP complexes (20 fmol) targeting golden in zebrafish embryos. Lateral views (top; scale bar, 0.5 mm) and insets of the eyes (bottom; scale bar, 0.25 mm) of the embryos at 48 hpf are shown. h. Stacked barplots showing the percentage of different mosaic mutants described in g. i. Schema illustrating a donor ssDNA (#1) complementary to the target strand (t) and with asymmetric homology arms used in combination with LbCpf1-crRNA. PAM sequence was modified (TgaV/ActB) to prevent new editing post-HDR. An optimized ssDNA donor (#2) described for SpCas9-induced HDR8 was used in combination with SpCas9-sgRNA RNP as reference for comparison (bottom). j. qPCR quantification showing percentage of HDR from individual embryos when using LbCpf1 in comparison with SpCas9 in the conditions described in i. To measure % HDR, specific primers to amplify DNA integrations were used following a similar approach described in Supplementary Fig. 10b and h and albino genomic primers were used to estimate genomic DNA amount (Supplementary Data 1, see Methods). % of HDR: amount of integrated DNA per total amount of genomic DNA per embryo (see methods for details). Results are shown as the averages ± standard deviation of the means from 16 embryos in two independent experiments (n=8 embryos per experiment). Positive Embryos: number of embryos per condition showing a detectable qPCR amplification signal. The data were subjected to unpaired two-tailed Mann-Whitney test and no significant differences (ns) were found between LbCpf1 and SpCas9. |

