- Title
-
Transient cardiomyocyte fusion regulates cardiac development in zebrafish
- Authors
- Sawamiphak, S., Kontarakis, Z., Filosa, A., Reischauer, S., Stainier, D.Y.R.
- Source
- Full text @ Nat. Commun.
|
Establishment of the FATC transgenic line for in vivo labeling of fusion-derived cells. a Schematic illustration of the ubb:FATC construct and Cre recombination products. b, c Schematic illustrations of membrane fusion (b) and multiple transgene insertions (c) that could give rise to LIFEACT-GFP expression. b Cre recombination of Tg(ubb:FATC) animals harboring a single copy of the transgene generates two different cell populations, one carrying a GAL4 expression cassette and the other carrying a UAS:LIFEACT-GFP (LAGFP) cassette. Fusion between cells carrying different cassettes (green arrows), but not between cells carrying the same cassette (black arrows), leads to activation of LIFEACT-GFP expression (green). c Stochastic Cre recombination in cells harboring two copies of the FATC transgene will generate 50% of the time cells carrying both the GAL4 and UAS:LIFEACT-GFP cassettes (green). d, e LIFEACT-GFP expression is activated in fast twitch, but excluded from slow twitch, muscles. d Drawing of a zebrafish larva depicting the trunk area (red box), shown in e. e Tg(ubb:FATC);Tg(hsp:cre) embryos were heat-shocked at 24 hpf, and LIFEACT-GFP expression (green) was assessed at 5 dpf. Muscle fibers were visualized by immunostaining with EB165 and F59 (red) to label fast and slow twitch muscles, respectively. DAPI (blue) labeling shows fusion-derived multinucleation of fast twitch muscles. f heat induction of cre expression at 24 hpf activates LIFEACT-GFP (green) expression in skeletal and cardiac myocytes in 5 dpf Tg(ubb:FATC);Tg(hsp:cre) larvae, but not in Tg(ubb:FATC) animals (blue). g LIFEACT-GFP expression (green) labels sarcomeric structures of FATC-activated cardiomyocytes (identifiable by membrane expression of mKATE-CAAX (red)). Absence of LIFEACT-GFP expression without 4-OHT treatment confirms the dependency of the FATC reporter on Cre activity. e, f show maximum intensity projections of 10–50 μm thick confocal stacks. g 3D volume renderings of 90 μm thick confocal stacks of the entire cardiac ventricle. Representative images from a total of 8–9 (e), 32 (f), and 9 (g) animals are shown. Scale bars: 20 μm (e, f trunk, g), 50 μm (f heart) |
|
Cardiomyocyte proliferation does not mediate FATC reporter expression. a Schematic illustration of the ubb:NATC construct and Cre recombination products. b Schematic illustration of the cellular events that could occur in the experiment shown in c. c NTR-mCherry+ (red) cardiomyocytes (H2B-GFP+, green) were observed in Tg(ubb:NATC);Tg(myl7:creER);Tg(myl7:H2B-GFP) larvae following MTZ-mediated cell ablation, 7 days after transient CreER activation by 4-OHT treatment at 24 hpf. All images show the same heart. d NTR-mCherry expression does not succeed cardiomyocyte DNA synthesis. The 6 h EdU pulse-labeled cells undergoing DNA synthesis (green) in 54 hpf Tg(ubb:NATC);Tg(myl7:creER) embryos. Two hours prior to EdU removal, Cre activity was induced by an 18 h 4-OHT treatment. mCerulean (blue) and NTR-mCherry (red) expression was visualized by immunostaining. No EdU+NTR-mCherry+ cardiomyocytes were detectable in 20 hearts imaged. c, d Maximum intensity projections of 40–60 μm thick confocal stacks. Representative images from a total of 12 (c) and 20 (d) animals are shown. Scale bars: 10 μm (c), 20 μm (d) |
|
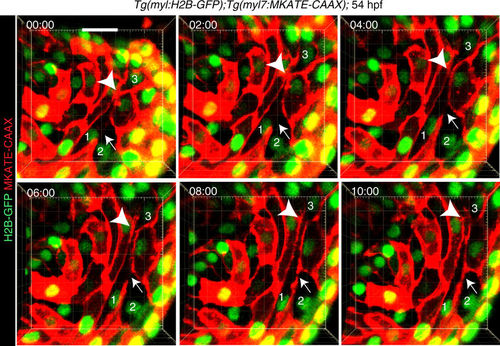
Membrane fusion occurs in the developing heart. Live imaging of Tg(myl7:MKATE-CAAX);Tg(myl7:H2B-GFP) embryos, in which heartbeats were blocked by morpholino-mediated tnnt2 knock-down (Supplementary Movie 1), showing establishment of a new membrane border (arrows) between cardiomyocytes 1 and 2, which initially exhibited cytoplasmic continuum. The plasma membrane border between cardiomyocytes 1 and 3 (arrowheads) dissolved and was subsequently re-established. mKATE-CAAX (red) and H2B-GFP (green) expression labeled cardiomyocyte membranes and nuclei, respectively. Timing of each still image is hour:minute. All images are 3D volume renderings of 60 μm thick confocal stacks of a representative heart showing the myocardial monolayer observed from the lumen. Examples of cytoplasmic continuum between cardiomyocytes were observed in all 6 hearts examined. Scale bar: 20 μm |
|
Blastula transplantations reveal cardiomyocytes expressing both donor and host transgenes. a Schematic drawing of transplantation experiment shown in b–d. Tg(myl7:EGFP) cells were transplanted into Tg(myl7:nDsred2) hosts at the blastula stage. b–d Cardiomyocytes expressing both host-derived myl7:EGFP (green cytoplasm) and donor-derived myl7:nDsred2 (red nucleus) transgenes (b) are evident from orthogonal sections (c) and Y axis rotation of a 3D volume rendering (d). EGFP+nDsred2+ cardiomyocytes (white circle) were detected in 9 out of 18 mosaic hearts at 3 dpf. e Schematic drawing of transplantation experiment shown in f–h. Tg(actb2:loxP-mCherry-loxP-EGFP) cells were transplanted into Tg(myl7:creER) hosts at the blastula stage. Transplanted animals were treated with 4-OHT starting at 24 hpf. New 4-OHT was added to the embryo medium daily. f A single focal plane of a confocal stack shows a dorsal view of a 3 dpf chimeric heart, anterior up. Donor-derived mCherry+ cells (red) and fusion-derived EGFP+ cardiomyocytes (green, arrows) were detected by live imaging in 5 out of 13 mosaic hearts (mixed genotypes, creER+ and creER−). g Maximum intensity projection of a 50 μm confocal stack shows a lateral view of a 7 dpf chimeric heart, anterior up, dorsal to the left. Tg(actb2:loxP-mCherry-loxP-EGFP) donor cells are shown in red. Host-derived Cre-mediated recombination of the donor transgene was detectable by EGFP immunofluorescence (green) in 11 out of 39 mosaic hearts (mixed genotypes, creER+, and creER−). h Magnified image showing area outlined by red box in g. Scale bars: 20 μm |
|
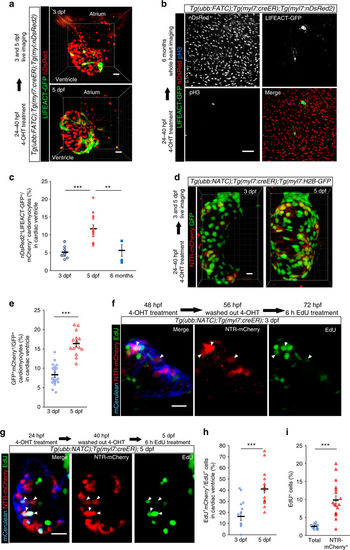
F/NATC-labeled cardiomyocytes are highly proliferative. a–c FATC-activated (LIFEACT-GFP+, green) cardiomyocytes (nDsRed+, red) in 3 and 5 dpf (a) and 6 mpf (b) Tg(ubb:FATC);Tg(myl7:creER);Tg(myl7:nDsRed2) fish treated with 4-OHT from 24 to 40 hpf were quantified as percentages of total ventricular cardiomyocytes (c). The same fish were analyzed at 3 and 5 dpf (a, c). d, e NTR-mCherry+ (red) cardiomyocytes (H2B-GFP+, green) of 3 and 5 dpf Tg(ubb:NATC);Tg(myl7:creER);Tg(myl7:H2B-GFP) fish treated with 4-OHT starting at 24 hpf (d) were quantified as percentage of total ventricular cardiomyocytes (e). f–h NTR-mCherry+ cardiomyocytes contribute substantially to the proliferating subset of cardiomyocytes. Tg(ubb:NATC);Tg(myl7:creER) embryos were treated with 4-OHT starting at 48 (f) or 24 (g) hpf to identify NATC-activated cardiomyocytes (mCerulean+,blue, and mCherry+, red). A 6 h EdU pulse (green) starting at 72 (f) or 120 (g) hpf labeled cells undergoing DNA synthesis. Arrowheads point to mCerulean+mCherry+EdU+ cardiomyocytes, which were quantified as percentages of total EdU+ ventricular cardiomyocytes (h). i Percentages of proliferating cardiomyocytes, assessed by a 6 h pulse of EdU, relative to total cardiomyocytes and relative to the NTR-mCherry+ cardiomyocyte population in 5 dpf Tg(myl7:nuDsRed2) and Tg(myl7:creER);Tg(ubb:NATC) ventricles, respectively. Three-dimensional volume renderings (a, d) and maximum or average intensity projections (b, f, g) of 90 (a, b), 84 (d), and 10–14 (f, g) μm thick confocal stacks are shown. In c, e, h and i, bars and error bars represent means ± S.E.M. Each circle (n = 12 in c, 20 in e, 10 in h, and 9 in i), triangle (n = 12 in c, 20 in e, 19 in h, and 19 in i), and square (n = 3) represents a cardiac ventricle. **p ≤ 0.01, ***p ≤ 0.001 (two-tailed student’s t-test). Representative images from a total of 12 (a), 3 (b), 18 (d), 11 (f), and 19 (g) animals are shown. Scale bars: 20 μm (a, d, f, g), 50 μm (b) |
|
Transgene coupling-mediated fluorescence expression in the adult heart increases after injury. a–c Cardiac injury induces NATC reporter expression. 6 mpf Tg(ubb:NATC);Tg(myl7:creER) fish were injected with 4-OHT intraperitoneally 30 days prior to cryoinjury. a Whole-mount immunostaining revealed that NTR-mCherry+ cardiomyocytes (red) were localized mainly adjacent to the damaged area (dashed line), identified by disorganized cardiac cells (DAPI+, blue). b Cytoplasmic NTR-mCherry (red) and nuclear DAPI (blue) labeling shows sham- and injury-induced NATC-activated cardiomyocyte morphologies; arrowheads point to double-labeled cardiomyocytes. c Ratios of mean gray values of NATC and DAPI labeling were calculated from maximum intensity projections of 200 μm thick confocal images of individual hearts. d Many NTR-mCherry+ cardiomyocytes (red) detected mainly at the lesion border zone (disorganized cardiac cells are revealed by DAPI staining, blue) were phospho-histone H3 (pH3, green) positive. e, f The majority of mitotic cardiomyocytes at the lesion border zone show NATC reporter expression. e NTR-mCherry (red) and myosin heavy chain (MHC, green) expression were detected by immunostaining of 6 mpf sham-operated and cryoinjured Tg(ubb:NATC); Tg(myl7:creER) hearts, in which Cre had been activated by 4-OHT treatment from 24 to 40 hpf. NTR-mCherry+ cardiomyocytes undergoing mitosis (white circles) were detected with an 8 h EdU pulse (EdU+ nuclei are in white) and their numbers were quantified as percentages of total numbers of mitotic cardiomyocytes (f). Cardiac cells were visualized by DAPI (blue) staining. Representative Tg(ubb:NATC);Tg(myl7:creER) hearts from four sham and six injured hearts (a–d), and three sham and three injured hearts (e, f) are shown/analyzed. Images are maximum or average intensity projections (a, e) and 3D volume renderings (d, e) of 200–300 (a), 20 (b, e), and 300 (d) μm thick confocal stacks. Bars and error bars in c, f represent mean ± S.E.M. Each circle (n = 4 in c and 3 in f) and triangle (n = 6 in c and 3 in f) represents a heart. *p ≤ 0.05, **p ≤ 0.01 (two-tailed student’s t-test). Scale bars: 5 μm (b), 20 μm (e), 30 μm (d), 50 μm (a) |
|
Cell fusion deficiency negatively affects cardiomyocyte proliferation and cardiac function. a–d jam3b mutants show a reduction in the number of LIFEACT-GFP+ skeletal and cardiac myocytes. Embryos from a cross of jam3b +/− ;Tg(ubb:FATC) and jam3b +− ;Tg(hsp:cre) fish were heat-shocked at 24 hpf. LIFEACT-GFP+ (green) skeletal (a) and cardiac (b) muscles were detectable at 48–52 hpf. DAPI-stained nuclei are shown in blue. c, d LIFEACT-GFP+ skeletal myocytes per 10,000 μm2 of trunk surface area (c) and LIFEACT-GFP+ ventricular cardiomyocytes (d) in jam3b −/− embryos and jam3b +/? siblings. e–g Jam3b deficiency reduces cardiomyocyte proliferation. A 16 h EdU pulse (green) labeled mitotic cardiomyocytes (nDsRed+, red) (e) shown as percentage of total cardiomyocytes (f); total cardiomyocyte numbers (g) in ventricles of 6 dpf jam3b −/− ;Tg(myl7:nDsRed2) and jam3b +/? ;Tg(myl7:nDsRed2) siblings. h–j jam3b deficiency impairs cardiac function. h The 5 dpf jam3b mutants exhibit pericardial edema (28 out of 36 fish with edema were jam3b−/−). i, j The 5 dpf jam3b mutants also display decreased fractional shortening (i) and blood flow velocity (j) compared to control siblings, as evidenced by a significant difference in average maximum flow velocity (k). a, b, e are maximum or average intensity projections of 20–65 μm thick confocal stacks. h are single focal planes of confocal images showing larvae in lateral views, anterior up and dorsal to the left. In all plots, bars and error bars represent means ± S.E.M. Each circle and triangle represents an embryo (c) or a heart (d, f, g, k, j). *p ≤ 0.05, **p ≤ 0.01, ***p ≤ 0.001 (two-tailed student’s t-test); 10–12 (a–d), 16 (e–g), 36 (h), and 11–25 (i–k) −/− and +/? sibling animals were examined. Scale bars: 20 μm (a, b, e), 40 μm (h) |
|
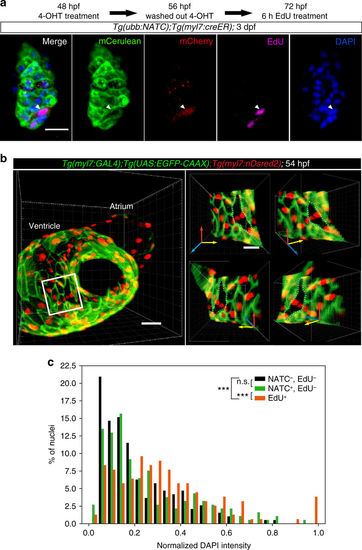
Membrane fusion does not generate multinuclear or polyploid cardiomyocytes. a Mononucleated NATC-activated cardiomyocytes undergo mitosis. Tg(ubb:NATC);Tg(myl7:creER) embryos were treated with 4-OHT from 48 to 56 hpf. At 72 hpf, the larvae were given a 6 h EdU pulse. Membrane Cerulean (green) and cytoplasmic mCherry (red) expression were visualized by immunostaining. EdU (magenta) and DAPI (blue) staining shows a single nucleus in the EdU + mCherry+ cardiomyocyte (arrowhead). 7.2 μm thick confocal stacks are shown as maximum intensity projections. b Binucleation is rarely observed in embryonic cardiomyocytes. Images are 3D volume renderings of a 54 hpf heart. Cardiomyocyte membrane and nuclei were visualized by Tg(myl7:GAL4);Tg(UAS:EGFP-CAAX) (green) and Tg(myl7:nDsRed2) (red) expression, respectively. Y axis rotation of the ventricular area (small panels on the right), indicated by the white box shows the single-layered compact myocardium with a binuclear cardiomyocyte, outlined with white dashed lines. c Among the EdU− populations, the distributions of DAPI intensity in NTR-mCherry+ cardiomyocytes (green bars) and NTR-mCherry− cardiac cells (black bars) were similar, indicating that DNA content in fused cardiomyocytes is not different from that of non-fused cardiac cells. On the contrary, and as expected, DNA content in EdU+ cells (red bars) was significantly higher than that in EdU− cells (either NTR-mCherry+ or NTR-mCherry−). Tg(ubb:NATC);Tg(myl7:creER) embryos were treated with 4-OHT from 24 to 40 hpf. NTR-mCherry expression and proliferating cells were labeled by immunostaining at 7 dpf after a 16 h EdU pulse. DAPI intensity measurements were performed on 3D volume-renderings obtained from confocal images. n = 311 NTR-mCherry−EdU− cells, n = 227 NTR-mCherry+EdU− cells, n = 173 EdU+ cells, from 5 larvae. ***p < 0.001, n.s., not significant, two-sample Kolmogorov–Smirnov test. Representative images from 11 larvae (a) and 10 embryos (b) are shown as average intensity projections (a) and 3D surface renderings (b) of 12 (a) and 60 (b) μm thick confocal stacks. Scale bars: 20 μm (a, b small panels), 30 μm (b, large panel on the left) |
|
FATC reporter expression is restricted to a few tissues. A, List of tissues containing LIFEACT-GFP+ cells, observed between 4-7 dpf, upon ubiquitous and cell-type specific cre expression in Tg(ubb:FATC) animals. Ubiquitous cre expression by the heat-inducible Tg(hsp70:cre) or injection of cre mRNA in Tg(ubb:FATC) embryos gave rise to LIFEACT-GFP+ skeletal and cardiac myocytes, and skin cells. A few cells in the liver and central nervous system (CNS), were also LIFEACT-GFP+. 4-OHT induction of cardiomyocyte-specific cre expression in Tg(ubb:FATC);Tg(myl7:creER) embryos at 24 hpf led to LIFEACT-GFP+ cardiomyocytes. No LIFEACT-GFP+ cells were detectable in Tg(ubb:FATC);Tg(kdrl:cre) animals in which cre is constitutively expressed in endothelial lineage cells. B-E, Embryos from Tg(ubb:FATC) and Tg(hsp:cre) crosses were heat-shocked at 24 hpf to induce ubiquitous cre expression. While the expression of the ubb:FATC transgene was observed by membrane Cerulean fluorescence (blue) in all tissues, a few LIFEACT-GFP+ cells (green, arrowheads) were detectable in the CNS (B) and the liver (C) at 5-7 dpf. The muscle (D and E) and the skin (not shown) were the only tissues that contained significant numbers of LIFEACT-GFP+ cells. Areas enclosed by white dashed lines are the tectal neuropil (B), liver (C), pancreas (D), and spinal cord (E). Red dashed lines mark the midbrain-hindbrain boundary (B), gall bladder (C), intestine (D), and dorsal aorta (E). All images are maximum intensity projections of 20-60 μm thick confocal stacks. B is dorsal view, anterior up. C-E are lateral views, dorsal to the left, anterior up. 12-39 animals were examined for each cre expression method. |
|
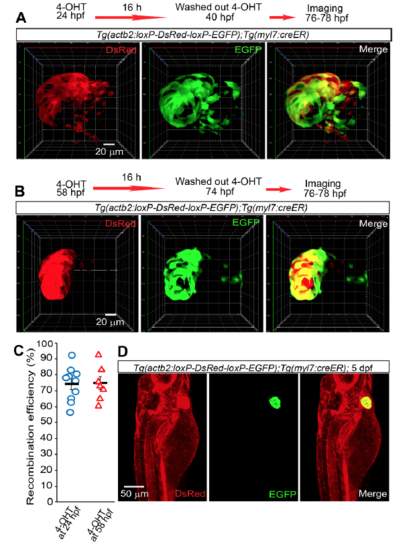
Recombination efficiency and tissue specificity of Tg(myl7:CreER). Tg(actb2:loxP-DsRed-loxP-EGFP);Tg(myl7:creER) embryos were treated with 4-OHT from 24 to 48 (A) or from 58 to 74 (B) hpf. Cre recombination-mediated EGFP (green) expression and non-recombined cells expressing DsRed (red) were assessed by live imaging from 76 to 78 hpf. Since it was not possible to count the number of cells due to the dense expression pattern of DsRed and EGFP, in order to quantify recombination efficiency we measured the area covered by EGFP expression (recombined cells) and the total cardiac ventricle area (combined EGFP and DsRed signals) in each Z-plane. C, Graph showing recombination efficiency calculated as percentage of GFP+ area/total cardiac ventricle area. D, myl7:creER mediates myocardial specific recombination. 4-OHT treatment of Tg(actb2:loxP-DsRed2-loxP-EGFP);Tg(myl7:creER) embryos from 24 to 40 hpf resulted in EGFP (green) expression only in the myocardium, imaged at 5 dpf, despite ubiquitous expression of DsRed (red). 3D volume renderings (A and B) or maximum intensity projections (D) of 170 (A), 122 (B), 406 (D) μm thick confocal stacks are shown. A and B are ventral views, anterior up. D is lateral view, anterior up and dorsal to the left. Bars and error bars in C represent means±S.E.M. Each circle (n=10) and triangle (n=7) represents a heart. 10 (A), 7 (B), and 5 (C) animals were analyzed. |
|
Comparable expression patterns of FATC and NATC reporters in specific tissues. Embryos from crosses of Tg(hsp:cre);Tg(ubb:FATC) to Tg(hsp:cre);Tg(ubb:NATC) animals were heat-shocked at 24 hpf and sorted at 3 dpf as Tg(ubb:FATC);Tg(ubb:NATC) (A, D, G, and J), Tg(ubb:FATC) (B, E, H, and K), or Tg(ubb:NATC) (C, F, I, and L) based on LIFEACT-GFP (green) and NTR-mCherry (red) expression in skeletal muscles. Skeletal muscle (H and K), myocardium, and skin (see Fig. S1) are the only tissues showing LIFEACT-GFP or NTR-mCherry expression in the presence of Tg(ubb:FATC) or Tg(ubb:NATC) alone. Radial glial cells and neurons in the brain (A-C), and the retina (D-F), pronephric duct cells (G-I), and endothelial cells (J-L) expressed F/NATC reporter only in Tg(ubb:FATC);Tg(ubb:NATC) larvae (in which Cre recombination of both transgenes can generate GAL4 and UAS:LIFEACT-GFP, or UAS:NTR-mCherry, expression cassettes independently of ploidy number or fusion). All images are average or maximum intensity projections of 20 (A-F) and 4 (G-L) μm thick confocal stacks of 6 dpf larvae. White dashed lines mark tectal neuropil (A-C), inner plexiform layer (D-F), pronephros (G-I). White arrowheads (J) point to NATC+ cells in the dorsal aorta. Note that some autofluorescent cells are present in the brain (A-C), skin and gut (J-L). 6 Tg(hsp:cre);Tg(ubb:FATC), 9 Tg(hsp:cre);Tg(ubb:NATC), and 8 Tg(hsp:cre);Tg(ubb:FATC); (ubb:FATC) animals were examined. |
|
Cre activity from injected creER mRNA appears to be lost by 4 days. Tg(actb2:loxP-DsRed-loxP-EGFP) embryos were injected with creER mRNA at the 1-4 cellstage. Embryos and larvae were then subjected to an overnight treatment with 4-OHT at 10 hpf (A-D), 2 dpf (E-H), or 4 dpf (I-L). Images were acquired 48 hours after the 4-OHT pulse. Cre activity was detectable by EGFP expression (green). DsRed expression (red) persisted in cells with no Cre activity. All images are maximum intensity projections of 200-350 μm thick confocal stacks and are shown in lateral views, dorsal to the left, anterior up. 6-10 animals were examined for each experimental condition. |
|
Cardiac injury induces NATC reporter expression. Tg(ubb:NATC);Tg(myl7:creER) fish were 6 months old when cardiomyocyte-specific CreER was activated by intraperitoneal 4-OHT injection. 30 days later, the animals were subjected to cardiac cryoinjury or sham operation. NTR-mCherry expression (red) in sham-operated (A-C) and cryoinjured (D-H) hearts from sibling animals were visualized by immunostaining at 7 days post injury (dpi). DAPI (blue) nuclear staining shows disorganized cells in the damaged area, outlined by white dashed lines. Each image is an average intensity projection of an individual heart from a 200-300 μm thick confocal stack. A total of 4 sham and 6 cryoinjured hearts were analyzed and are shown here and in Fig. 6A. |
|
F/NATC reporter expression correlates with cell proliferation during adult heart regeneration. A-F, FATC+ cells proliferate during cardiac regeneration. Tg(ubb:FATC);Tg(hsp:cre) fish (20 months old) were heat-shocked to induce cre expression, followed by cardiac cryoinjury 5 days later. Activation of FATC reporter, visualized by LIFEACTGFP expression (green), and mitotic activity, detected with phospho-Histone H3 immunostaining (pH3, red), in injured hearts was assessed at 7 dpi. Disorganized cells, visualized by DAPI (blue) staining, define the damaged area (white dashed lines). G-L, NATC-activated cells localized mainly adjacent to the damaged area. 12-month-old Tg(ubb:NATC);Tg(hsp:cre) fish were heatshocked to induce cre expression 5 days prior to cardiac cryoinjury. NTR-mCherry expression (red) was visualized by immunostaining at 7 dpi. DAPI (blue) nuclear staining shows disorganized cardiac cells in the injured area, outlined by white dashed lines. M-O, NTR-mCherry+ cells exhibit an atypical morphology that resembles immature/dedifferentiated cardiomyocytes. Each image is from an individual heart shown as a 3D volume rendering of a 100-400 μm thick confocal stack. 3 Tg(ubb:FATC);Tg(hsp:cre) and 6 Tg(ubb:NATC);Tg(hsp:cre) animals were examined. |
|
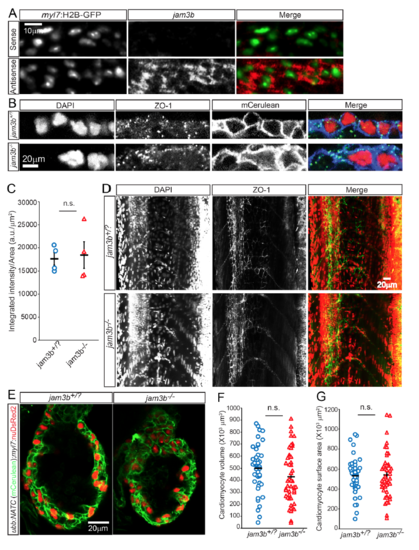
Unaltered cardiomyocyte adhesion and morphology in jam3b mutants. A, In situ hybridization detected the expression of jam3b (red) in cardiomyocytes, labeled by myl7:H2B-GFP expression (green nuclei). B, Expression levels of the tight junctionassociated protein ZO-1 at the plasma membrane of jam3b-/- hearts were comparable to those of control animals (jam3b+/? = jam3b+/+ or jam3b+/-). 3 dpf animals from jam3b+/-;Tg(ubb:NATC) X jam3b+/- crosses were processed for whole mount immunostaining for ZO-1 (green) and GFP (detecting membrane Cerulean, blue). DAPI labeled nuclei are shown in red. C, Quantification of ZO-1 expression levels based on integrated intensity of the ZO-1 signals per plasma membrane area of individual cardiac ventricle. D, Jam3b deficiency does not appear to affect tight junction formation in epithelial or endothelial tissues. Expression and localization of ZO-1 (green), detected at 3 dpf by immunofluorescence, in jam3b-/- larvae appear identical to those in control jam3+/? siblings. DAPI staining (red) shows that skeletal myocytes are mononucleated in jam3b-/- fish, while they are mutinucleated in jam3b+/? siblings. E-G, Jam3b deficient animals show unaltered cardiomyocyte morphology. E, 5 dpf larvae from jam3+/-;Tg(ubb:NATC) X jam3+/-;Tg(myl7:nuDsRed2) crosses were immunostained to detect membrane Cerulean (green) and nuclear DsRed2 (red) expression. F, G, Graphs showing that cardiomyocyte volume (F) and surface area (G) were not altered in jam3b-/- larvae. Bars and error bars in C, F, and G represent means±SEM. n.s. not significant. Images are maximum or average intensity projections of 4 (A, B, and E), and 20 (D) μm thick confocal stacks shown in lateral views. 6-12 (A), 4 (B and C), 6-8 (D) larvae and 44 (F) or 49 (G) cardiomyocytes were examined. |
|
Jam3b deficiency impedes FATC activation in skeletal muscles. A-P, Embryos from crossing jam3b+/-;Tg(ubb:FATC) fish to jam3+/-;Tg(hsp:cre) fish were heatshocked at 24 hpf. At 48-50 hpf, skeletal muscles in control animals (A-H, jam3b+/?=jam3b+/+ or jam3b+/-) were multinucleated, as visualized by DAPI staining (blue), and showing LIFEACT-GFP (green) expression. By contrast, in jam3b mutants (I-P, jam3b-/-), most muscles were mononucleated and their nuclei centrally positioned within each myotome. Correspondingly, the numbers of LIFEACT-GFP+ skeletal myocytes were reduced. Q, A few LIFEACT-GFP+ (green) myocytes detected in jam3b-/- embryos were multinucleated, as shown by DAPI staining (blue). Arrowheads point to nuclei of LIFEACT-GFP+ cells. Images are maximum intensity projections from 17.5-25 (A-P) and 10 (Q) μm thick confocal stacks of individual animals and shown in lateral views, dorsal to the left, anterior up. 10-12 embryos of each genotypes were examined. |
|
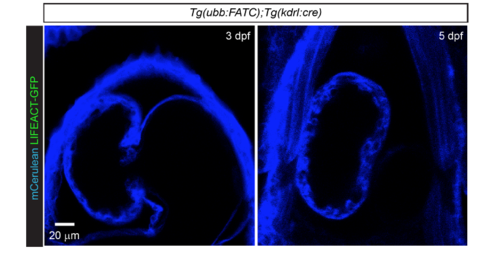
Endothelial lineage cells are not involved in cardiomyocyte FATC reporter expression. Tg(ubb:FATC) ;Tg(kdrl:cre) animals in which cre was constitutively expressed in endothelial and hematopoietic progenitor cells showed no LIFEACT-GFP+ (green) cells in the myocardium. mCerulean expression (blue) confirmed the presence of the ubb:FATC transgene. LIFEACT-GFP induction was assessed in 3 and 5 dpf animals. Images are average intensity projections of 12 μm thick confocal stacks shown in ventral views, anterior up. 12 animals were examined at each developmental stage. |


