
- Title
-
Role of gabra2, GABAA receptor alpha-2 subunit, in CNS development.
- Authors
- Gonzalez-Nunez, V.
- Source
- Full text @ Biochem Biophys Rep
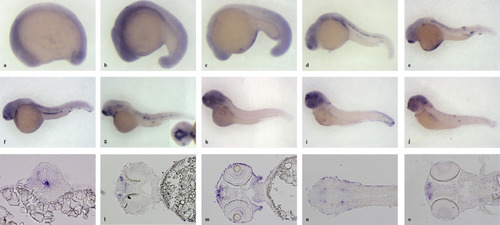
Developmental expression of gabra2 transcript. Analysis of dre-gabra2 expression by in situ hybridisation on wholemount embryos of (a) 11 somites, (b) 17 somites, (c) 20 hpf, (d) 24 hpf, (e) 30 hpf, (f) 36 hpf, (g) 42 hpf, (h) 48 hpf, (i) 3 dpf and (j) 4 dpf. (a–j) lateral views are shown, where embryos are oriented with the anterior towards the left. Inset of (g): ventral view of the head. (k–o) higher magnification images taken from 20 μm-thick sections that were obtained from stained embryos. (k) transverse section (oriented dorsal up) of a 24 hpf embryo at the level of the spinal cord, where intense labelling is seen at the floor plate of the neural tube. (l) coronal section (oriented anterior to the left) of an embryo of 48 hpf; staining is found lateral to the olfactory bulbs. (m and n) coronal sections (oriented anterior to the left) of embryos of 72 hpf, where gabra2 expressing cells are located at surroundings of the olfactory bulbs (m), in the ganglion cell layer of the retina (m) and in some nuclei of the thalamus and of the medulla oblongata (n). (o) coronal section (oriented anterior to the left) of an embryo of 4 dpf, where the olfactory epithelium is labelled with the gabra2 ISH probe. EXPRESSION / LABELING:
|

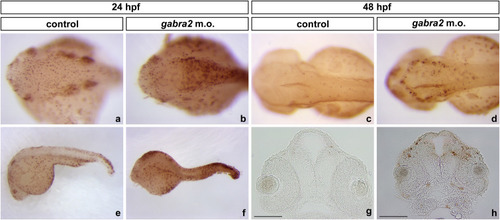
Proliferation studies on gabra2 deficient embryos. Phospho-histone 3 (Ser10) immunostaining [23] on zebrafish control embryos and on embryos that were microinjected with gabra2 morpholino. In all cases embryos are oriented with the anterior towards the left and in (a–h) cell nuclei were counterstained with DAPI (blue). (a–d) Images from wholemount immunostainings that were taken with a Leica M165FC Stereomicroscope a and b) Wholemount embryos of 24 hpf, where it can be seen that proliferation pattern in the periventricular areas of the brain is disrupted in the morphant embryos. (c and d) At 48 hpf, the proliferative pattern is mainly restored, although the labelling for the mitotic marker is increased in the periventricular areas of the mid- and hindbrain from morpholino-injected embryos. (e–h) Images from 14 μm thick cryosections that were taken with an Olympus AX70 fluorescence microscope. (e and f) sagittal views of the fore- and midbrain from embryos of 24 hpf; in control embryos, positive cells are scattered throughout the ventral area of the brain, while mitotic cells show a more anterior and dorsal location in the morphant. (g and h) coronal sections from embryos of 48 hpf; proliferative cells are found along the midline of the tegmentum and in the outermost external cell layer of the retina in the morpholino-injected embryos, whereas control embryos display a more restricted pattern of proliferation in the CNS. (i–l) Higher resolution images of 14 μm thick cryosections taken with a Leica confocal microscope. The periphery of the embryos, the eyes, lens, ventricles and yolk are outlined with dashed lines. (i and j) mid-sagittal section of the hindbrain from embryos of 24 hpf, where it can be observed a dense distribution of positive cells along the wall of the ventricle in the morphant embryo. (k and l) coronal section of the developing brain at 48 hpf. The gabra2 deficient embryos display more labelled cells in the midline of the tegmentum and in the gill arches than controls. Labels: t: tegmentum; v: ventricle; y: yolk: *: gill arches. Scale bars: e and f: 200 μm; g and h: 100 μm; (i–l): 75 μm. |
Apoptosis assays on gabra2 morphant embryos. TUNEL staining on gabra2 deficient embryos of 24 hpf (a and b – dorsal views; e and f – lateral views) and 48 hpf (c and d – dorsal views; g and h – 20 μm thick coronal sections). At 24 hpf, there is an increase in the number of apoptotic nuclei (which are positive for peroxidase labelling) in the hindbrain region of morpholino-injected embryos [69.30±15.52 apoptotic nuclei in control embryos as compared to 164.6±36.87 in morphant embryos; * p<0.05 as determined by one sample t-test]. Apoptosis is reduced at 48 hpf when compared to morphants at 24 hpf (* p<0.05 as determined by one sample t-test), although gabra2 deficient fish display apoptotic cells in the walls of the third ventricle and in some regions of the forebrain. [36.87±4.67 apoptotic nuclei in control embryos as compared to 77.06±5.34 in morphant embryos; ** p<0.01 as determined by one sample t-test]. (a–f) Embryos are oriented anterior towards the left and posterior towards the right. (g and h) Orientation of embryos is anterior up; scale bar: 100 μm. |

Effect of the knocking down of gabra2 gene on the expression pattern of several developmental markers. ISH studies were conducted on control embryos (a, c, e, g, i, k, m, o, q and s) and on gabra2 morphants (b, d, f, h, j, l, n, p, r and t) at 24 hpf (a, b, e, f, i, j, m, n, q and r) and 48 hpf (c, d, g, h, k, l, o, p, s and t) to establish the expression pattern of several markers known to be involved in CNS development: (a–d) fgf8; (e–h) neuroD; (i–l) notch1a; (m–p) pax2a; and (q–t) wnt1. Note that the expression patterns of all genes are altered in gabra2 deficient fish, and that the mid- and hindbrain regions are more affected than the forebrain. Embryos are oriented with the anterior towards the left and posterior towards the right. (a, b, k, l and o–t) dorsal views; (c–j, m and n) lateral views. |

Expression pattern of gad1b on gabra2 deficient fish. The expression pattern of gad1b (GABA-synthesising enzyme GAD67)-GABAergic marker-was assayed by ISH on (a and c) control and b and d) gabra2 morphant embryos at 24 hpf (a and b) and 48 hpf (c and d). Note the reduction of the areas of expression (as determined by a decrease in the stained area) found for this gene at both stages. Dorsal views are shown, in which embryos are oriented with the anterior towards the left and posterior towards the right. |
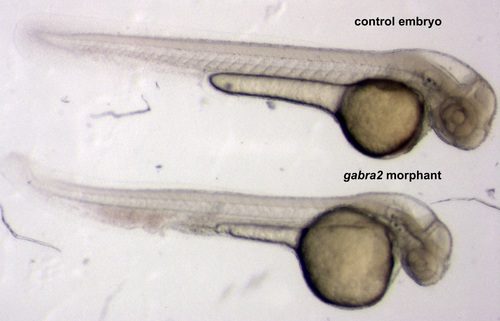
Macroscopic phenotype of gabra2 morphants. This image shows representative embryos of 48 hpf: a control embryo in the upper part vs. an embryo derived from an egg that was microinjected with 0.25 mM gabra2 morpholino. The morphant embryos display smaller size (89.59 ± 9.54% over control embryos; * p<0.05 as determined by one sample t-test) and CNS defects, as gabra2 is mainly expressed in the brain. Note that the size of the ventricles is increased in the morphant embryo. |

pax6a and shh a expression pattern is not altered in gabra2 deficient embryos. ISH studies performed on embryos at 24 hpf showed that the absence of gabra2 expression did not affect the characteristic pattern of expression of pax6a and shh a in the CNS. These two developmental markers did not seem to be greatly altered in the morphant embryos, as the expression patterns matched those seen in control embryos. |

GABAergic agents did not elicit significant changes in the pattern of proliferation and apoptosis during development. The effect of either 1 M GABA, 1 M muscimol (GABAA agonist) or 100 M bicuculline (antagonist) on proliferation was assessed by phospho-histone 3 (Ser10) immunostaining on wholemount embryos at 24 hpf (upper row). However, there is no clear change in the pattern of proliferation at 24 hpf between control embryos and those treated with GABAergic agents. Besides, there are no differences in the number of mitotic nuclei among groups [% proliferating nuclei: control group = 25.14 ± 7.26 %, 1 M GABA = 23.68 ± 4.29; 1 M muscimol = 22.35 ± 3.37; 100 M bicuculline = 23.49 ± 0.52. No statistically significant changes, as determined by One-way analysis of variance]. TUNEL staining (lower row) was conducted to label apoptotic cells, and only a slight increase in peroxidase labelling was obtained in drug-treated groups. Images are from flatmount preparations, where embryos are oriented anterior towards the left and posterior towards the right. Scale bar: 200 m. |