
- Title
-
Live imaging reveals distinct modes of neutrophil and macrophage migration within interstitial tissues
- Authors
- Barros-Becker, F., Lam, P.Y., Fisher, R., Huttenlocher, A.
- Source
- Full text @ J. Cell Sci.

Neutrophils and macrophages have different morphologies and motility dynamics in live zebrafish. (A) Schematic diagram of a 3 dpf larva. The blue square corresponds to the imaging area for random leukocyte migration. The orange line corresponds to a tail transection wound to induce directed migration. See Movie 1. (B) Time-lapse images of a neutrophil (left) and a macrophage (right) randomly migrating. Bars are shown on the lower panel to indicate the distance migrated. The white cross marks the initial position of the cell body. Scale bar: 50 µm. (C–F) Macrophage and neutrophil perimeter (C), and roundness (D) were measured. 2D speed (E) and directionality (F) of neutrophils and macrophages was measured by manual tracking of time-lapse videos. Data are representative of three independent experiments. P-values were calculated with an unpaired two-tailed t-test. |
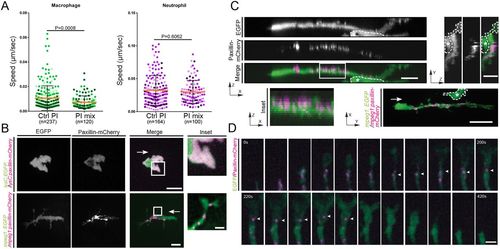
Macrophages but not neutrophils require proteases for migration and form paxillin puncta. (A) Macrophage random migration is affected when a broad-range protease inhibitor mix is included in the larval medium. Under the same conditions neutrophil migration is not affected. The mean±s.d. speed is shown; P-values were calculated with a least squares means analysis. (B) Transiently expressed paxillin–mCherry forms puncta in macrophages, but has a cytoplasmic distribution in neutrophils. The inset column shows a magnification of the boxed region. Scale bar: 10 µm (2.5 µm for inset). See Movie 2. (C) Paxillin–mCherry puncta are located close to the membrane (zx view and inset) on only one side of the cell (zx and yz projections). Scale bars: 10 µm (z-projections); 20 µm (xy-projection). Asterisks mark a nearby cell not labeled with paxillin. See Movie 3. White arrows in B and C mark the direction of cell movement. (D) Dynamics of paxillin puncta inside macrophage protrusions (20 s intervals). Paxillin puncta disperse before retraction of the protrusion. Arrowheads mark the same paxillin punctum. Scale bar: 2.5 µm. Data are representative of seven independent experiments where all macrophages showed paxillin in puncta (a total of 27/27). |
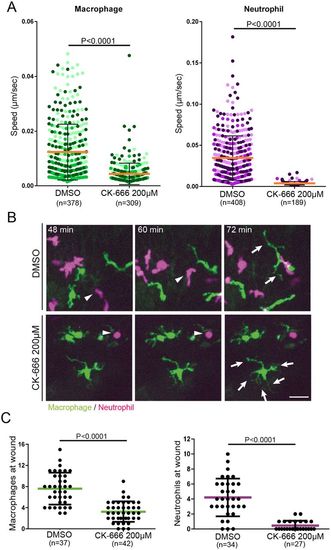
Arp2/3 inhibition affects macrophage and neutrophil migration. (A) Time-lapse imaging of neutrophils and macrophages during incubation with CK-666 (200 µM). The inhibitor blocked neutrophil random motility, and strongly impaired macrophage random motility. Mean±s.d. velocity is shown; P-values were calculated with a least squares means analysis. (B) Inhibition of the Arp2/3 complex affects cell morphology. Time-lapse images showing a representative macrophage and neutrophil morphology. Arp2/3 inhibition induced neutrophil rounding (white arrowheads), whereas macrophages generated long and multiple filopodia-like protrusions (white arrows). Scale bar: 25 µm. (C) In response to tail transection, neutrophil recruitment was completely blocked by CK-666, but macrophage recruitment was only partly impaired. Data are mean±s.d. and are representative of three independent experiments; P-values were calculated with a two-tailed unpaired t-test. |
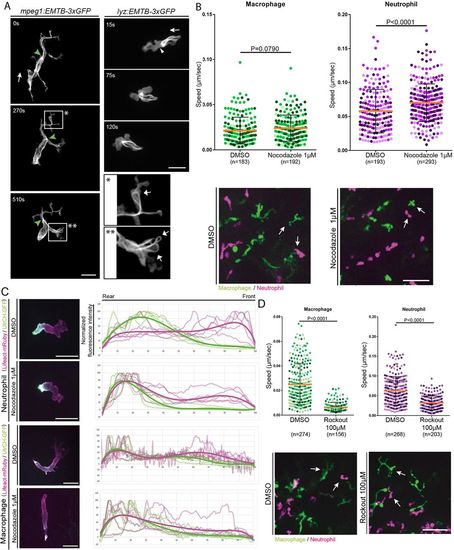
Microtubule and ROCK inhibition affects both neutrophil and macrophage migration in vivo. (A) EMTB-3xGFP transiently expressed in neutrophils showed microtubules localized at the back of the cell. Very few microtubules were localized at the front (white arrowhead). Macrophages expressing EMTB-3xGFP showed microtubules extending to the back of the cell and into protrusions at the leading edge. Scale bar: 20 µm. Macrophages transiently expressing EMTB-3xGFP showed microtubule loops in some protrusions (magnified views indicated by * and **; white arrows). See Movie 5. Green arrowhead, MTOC. White arrows in main panels indicate direction of migration. Images are representative of three independent experiments. (B) Microtubule inhibition using nocodazole 1 µM increased the velocity of neutrophils but not random macrophage motility. The mean±s.d. velocity is shown; P-values were calculated with a least squares means. Representative images below show that both cell types had morphology changes upon treatment with nocodazole (white arrows). See Movie 6. Scale bar: 50 µm. (C) UrtCH–GFP and Lifeact–mRuby localization in the presence and absence of nocodazole. Nocodazole induced hyperpolarization of UtrCH–GPF in neutrophils, but not macrophages. Actin intensity was quantified and normalized as a percentage of the total. The relative expression of UtrCH–GPF and Lifeact–mRuby is presented in a graph for the front-to-rear axis (bold line indicates trend line of each set of color values). Five cells from three independent experiments were quantified. Scale bars: 20 µm. (D) ROCK inhibition by treatment with 100 µM Rockout blocked macrophage migration, but had only a partial effect on neutrophil migration. Mean±s.d. speed is shown; P-values were calculated with a least squares means analysis. Representative images below the graph show the cell morphology changes for each condition. Scale bar: 50 µm. See Movie 8. |
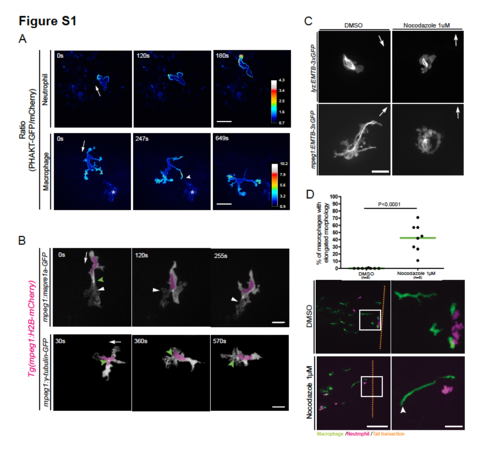
PHAKT-EGFP and microtubule localization during neutrophil and macrophage migration in live zebrafish. (A) Ratiometric imaging of neutrophils and macrophages. Neutrophils show presence of PIP3 at the leading edge. Macrophages show presence of PIP3 in all protrusions including the ones extending and retracting. Data are representative of 2 independent experiments for neutrophils and 3 independent experiments for macrophages. Scale bar, 20μm. Ratiometric scale shows numerical values. See Video 4. Asterisks mark non-specific signal. (B) Time-lapse imaging of macrophages transiently expressing Mapre1a-EGFP in a Tg(mpeg1:H2BmCherry) line. The signal is located at the front and back of the cell (white arrowhead show microtubules at the front) Scale bar, 20μm. Time-lapse images of transiently expressed gTubulin-EGFP in a Tg(mpeg1:H2B-mCherry) line. This probe shows the MTOC (green arrowhead) in the front of the nucleus in the direction of migration. White arrows indicate direction of migration. Scale bar, 20μm. (C) EMTB-3xGFP transiently expressed in neutrophils (lyz) and macrophages (mpeg1) showed that most microtubules are lost when nocodazole 1μM is present in the media. Scale bar, 20μm. Images are representative of 1 experiment. (D) Quantification of macrophages presenting a rear detachment phenotype, as a percentage of the total of macrophages during the timelapse movie. Nocodazole 1μM induced macrophage but not neutrophil elongation towards wounded tissues. White arrowhead labels trailing edge of an elongated macrophage. Scale bar, 100μm and 25μm for insets. See Video 7. Data are representative of 2 blind tests, from 4 independent experiments, with two-tailed unpaired t test. |