
- Title
-
Genomic dissection of conserved transcriptional regulation in intestinal epithelial cells
- Authors
- Lickwar, C.R., Camp, J.G., Weiser, M., Cocchiaro, J.L., Kingsley, D.M., Furey, T.S., Sheikh, S.Z., Rawls, J.F.
- Source
- Full text @ PLoS Biol.
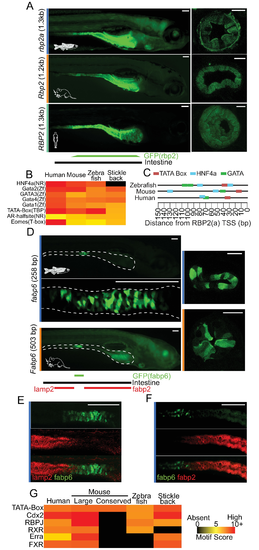
Exogenous regulatory regions identified by intestinal epithelial cell (IEC) accessible chromatin can drive regionally conserved IEC expression in zebrafish larvae. (A) (Left) Whole-mount stereofluorescence images of 7 dpf zebrafish stable lines expressing a green fluorescent protein (GFP) reporter construct for rbp2a/Rbp2/RBP2 accessible regulatory regions from zebrafish, mouse, and human show high levels of expression in IECs in the anterior portion of the intestine. Scale bar 100 μm. (Right) Representative cross-sections of zebrafish intestine confirming high IEC expression for each corresponding stable line. The zebrafish cross-section was taken in the posterior of the intestinal bulb, and the mouse and human cross-sections were taken within the middle of the intestinal bulb. Scale bar 25 μm. (B) Common motifs detected in the RBP2(a) cloned region for each species colored by Homer motif scores. Motif score scale is shared with Figure 4G. (C) Schematic of common transcription factor binding sites (TFBS) motifs found immediately upstream of the transcription start site (TSS) of RBP2(a) in zebrafish, mouse, and human. (D) (Left blue) Whole-mount stereofluorescence images of 7 dpf zebrafish stable line Tg(fabp6:GFP) show high levels of GFP expression in IECs in the middle of the intestine. (Below blue) Average projection of confocal stacks of whole-mount zebrafish Tg(fabp6:GFP). Scale bar 100 μm. (Right blue) Representative cross-section of zebrafish intestine confirming high IEC expression for Tg(fabp6:GFP). Scale bar 25 μm. (Left orange) Whole-mount stereofluorescence image of 7 dpf zebrafish stable line Tg(Mmu.Fabp6:GFP) shows high levels of GFP expression in IECs in the middle of the intestine. Scale bar 100 μm. (Right orange) Representative cross-section of zebrafish intestine confirming high IEC expression for Tg(Mmu.Fabp6:GFP). Scale bar 25 μm. A smaller conserved region from mouse and 2 inclusive regions from human FABP6 did not drive IEC GFP expression in our zebrafish reporter assay. Throughout, the white dashed line marks the boundary of intestine and IECs. (E) Confocal whole-mount maximum projection image showing lack of overlap between Tg(fabp6:GFP) and the segment 2 marker TgBAC(lamp2-RFP). Scale bar 100 μm. (F) Confocal whole-mount average projection image showing lack of overlap between Tg(fabp6:GFP) and the segment 1 marker Tg(-4.5fabp2:DsRed). Scale bar 100 μm. (G) Common motifs detected in the cloned or corresponding region for each species colored by Homer motif score. EXPRESSION / LABELING:
|
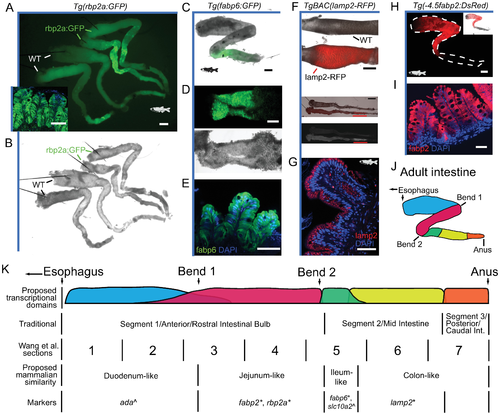
Transcriptional domains identified in larval zebrafish intestine are maintained in adults. (A) Stereomicroscopy image of 2 dissected adult Tg(rbp2a:GFP) intestines (top) and 2 wild-type (WT) intestines without green fluorescent protein (GFP) (bottom) shows high GFP expression between the first and second bend of the adult intestine in Tg(rbp2a:GFP). Autofluorescence can be seen in several intestines following the second bend, presumably due to bile or feces (see brightfield microscopy in B). Scale bar 1,000 μm. Confocal cross-section of adult Tg(rbp2a:GFP) intestinal folds with DAPI in blue shows GFP expression in intestinal epithelial cells (IECs) in the inset panel. Scale bar 50 μm. (B) Brightfield microscopy of 2 dissected adult Tg(rbp2a:GFP) intestines (top) and 2 wild-type intestines (bottom). Dissection pins can be seen as long black lines anchoring the intestine in the intestinal bulb. (C) Stereomicroscopy image of brightfield and GFP overlay for the dissected intestine of adult Tg(fabp6:GFP), showing GFP expression in a discreet domain immediately following the second bend. The anus was excluded in this preparation. Scale bar 1,000 μm. (D) Stereomicroscopy image of GFP (top) and brightfield (bottom) for the dissected adult intestine of Tg(fabp6:GFP) opened lengthwise to show internal detail of the discreet domain of GFP expression. Scale bar 1,000 μm. (E) Confocal cross-section of adult Tg(fabp6:GFP) intestinal folds with DAPI in blue shows high GFP expression in IECs. Scale bar 50 μm. (F) Stereomicroscopy close-up of red fluorescent protein (RFP) and brightfield for adult WT and TgBAC(lamp2-RFP) zebrafish lines (top) showing entire intestines with the segment 2 relative position marked with a red horizontal line (middle). Scale bar 2,000 μm. Fluorescence-only image showing the distribution of the lamp2-RFP signal, highest in segment 2 (bottom). The relative orientation of the WT (top) and TgBAC(lamp2-RFP) (bottom) lines is maintained throughout. (G) Confocal cross-section of adult TgBAC(lamp2-RFP) intestinal folds from segment 2 with DAPI in blue shows high lamp2-RFP expression in IECs. Scale bar 50 μm. (H) (Top) Stereomicroscopy image for a dissected intestine of adult Tg(-4.5fabp2:DsRed) showing DsRed expression most highly between the first and second bend with additional expression in the intestinal bulb. The white dotted line references the dissected intestine. A similar Tg(fabp2:RFP) result has previously been reported [15]. Scale bar 1,000 μm. Overlay between DsRed and brightfield is shown in the inset in the upper right. (I) Confocal cross-section of adult Tg(-4.5fabp2:DsRed) intestinal folds with DAPI in blue shows high DsRed expression in IECs. Scale bar 50 μm. (J) Schematic of dissected adult intestine showing major anatomical features overlaid with proposed transcriptional/functional domains shown in K. (K) Linear schematic representation of proposed transcriptional and functional domains of zebrafish intestine with potential regional gene markers and previously defined regional annotation. Boundaries should not necessarily be considered discrete, and domains may vary or overlap for different genes. Markers refer to proposed region-defining transcriptional markers determined using transgenic lines from this study (*) or from Wang et al. (^)[15]. Additional markers can be inferred from Fig 2 and S3 Fig, including markers for the most posterior region of the zebrafish intestine. EXPRESSION / LABELING:
|

Intestinal epithelial cell (IEC)-specific accessible chromatin at conserved noncoding elements identifies IEC regulatory elements. (A) Conserved nonexonic elements (CNEs) ordered by zebrafish IEC Formaldehyde-Assisted Isolation of Regulatory Elements sequencing (FAIRE-seq) signal at zebrafish conserved nonexonic elements (zCNE) center. (Left) Moving median of Fragments Per Kilobase of transcript per Million mapped reads (FPKM) levels of CNEs nearest gene feature (250 gene window, 1 step; color scheme based on data sets presented in Fig 1A and throughout), showing the relationship between accessible chromatin level and transcription at these conserved regions. (Right) Heat maps of accessible chromatin signals at the 1,000 bp, surrounding the CNE center, highlighting the similarity of signal in IECs at CNEs in all 4 species. Gray represents no mappable signal or failure to liftover to the stickleback genome, as the stickleback genome was not included in the CNE set [55]. (B) Peak overlap of IEC accessible chromatin datasets and human and mouse ENCODE/Roadmap data sets with CNEs in each respective species. Overlap is defined as having at least 1 shared base pair. (C) Cluster analysis of CNEs with at least 1 IEC accessible peak overlap from any of the IEC datasets. (D) Subset of CNEs containing peak overlap from each of the zebrafish, mouse ileum, mouse colon, and human colon IEC datasets, as well as substantial overlap with additional mouse and human data from mostly unrelated tissues. (E) The entire group of CNEs that have overlap with zebrafish intestine, mouse ileum, mouse colon, and human colon but few other data sets, identify potentially highly conserved IEC-specific regulatory elements. (F) Scatterplot of accessible chromatin signal at the center of CNEs for zebrafish IECs and mouse ileum IECs, which shows a positive conserved relationship between accessible chromatin signal at these sites. (G) Accessible chromatin data from the EGR1 locus highlighting the commonly accessible CNE_11264 in multiple species. (H) Whole-mount stereofluorescence of stable transgenic line harboring egr1 Tg(zCNE_11264:GFP) showing highest green fluorescent protein (GFP) expression in IECs in the mid intestine. (Bottom) Close-up view of zebrafish egr1 Tg(zCNE_11264:GFP) intestine. Scale bar 100 μm. (Right) Whole-mount confocal images confirming egr1 Tg(zCNE_11264:GFP) GFP expression in IECs. Scale bar 25 μm. (I) The same as H for stable line Egr1 Tg(mzCNE_11264:GFP). (J) The same as H for stable line EGR1 Tg(hzCNE_11264:GFP). (K) The distribution of CA/T-rich-G (CArG)/MCM1, AGAMOUS, DEFICIENS, and SRF (MADS box) and E26 transformation specific (ETS) motifs in human, mouse, zebrafish, and stickleback CNE_11264 show distinct motif distributions despite sequence conservation. Bronze bar represents conserved region. Dashed bar for human hzCNE_11264 represents the apparently conserved region that is adjacent to the hzCNE_11264 boundary marked with solid bronze bar. (L) Heatmap showing motif number (left) and highest motif score (right) for common motifs detected in CNE_11264. (M) Similarity relationship of CArG boxes detected in CNE_11264 shows the diversity of transcription factor binding sites (TFBS) despite overall sequence conservation. Numbering of CArG box sites is arbitrary. EXPRESSION / LABELING:
|

Hes1 conserved nonexonic element (CNE)-driven expression overlaps with Notch signaling and marks a specific population of intestinal epithelial cells (IECs). (A) Accessible chromatin at HES1 loci. (B) Whole-mount stereofluorescence of stable transgenic line 7 dpf zebrafish harboring hes1 Tg(zCNE_44665:GFP) showing green fluorescent protein (GFP) expression in IECs. Scale bar 100 μm. (C) Same as B, a closeup showing high GFP+ IECs in a population of cells. (D) Same as B, a confocal whole-mount z-stack maximum projection of zebrafish intestine showing high GFP+ in a population of IECs. (E) A confocal image of intestinal cross-section of 7 dpf hes1 Tg(zCNE_44665:GFP) showing GFP expression in IECs that appear at the base of slight invaginations (white arrows). Scale bar 25 μm. (F) A confocal intestinal cross-section of 7 dpf zebrafish shows lack of overlap between hes1 Tg(zCNE_44665:GFP) and enterocyte marker Tg(-4.5fabp2:DsRed). GFP+ IECs lacking Discosoma sp. red fluorescent protein (DsRed) are marked with a white arrow. Scale bar 25 μm. (G) Lack of overlap between hes1 Tg(zCNE_44665:GFP) and the enteroendocrine marker Tg(neurod1:TagRFP) [87]. A reduction in background GFP can be seen at red fluorescent protein (RFP)+ cells (white arrow). Scale bar 25 μm. H) A confocal cross-section image shows overlap between hes1 Tg(zCNE_44665:GFP) and Tg(EPV.Tp1-Ocu.Hbb2:hmgb1-mCherry) in 7 dpf zebrafish. Individual channels are shown in inset with DAPI in blue. Scale bar 25 μm. I) A confocal image of cross-section of 8-week-old zebrafish intestinal folds in hes1 Tg(zCNE_44665:GFP) and Tg(EPV.Tp1-Ocu.Hbb2:hmgb1-mCherry). (J) A stereoscopic image showing the overlap of whole-mount human HES1 Tg(hzCNE_44665:GFP) and Tg(EPV.Tp1-Ocu.Hbb2:hmgb1-mCherry) in a subset of IECs in 7 dpf zebrafish. Scale bar 100 μm. (K) A confocal cross-section of 7 dpf zebrafish showing the overlap of human HES1 Tg(hzCNE_44665:GFP) and Tg(EPV.Tp1-Ocu.Hbb2:hmgb1-mCherry). Scale bar 25 μm. (L) Heatmap of common TFBS motifs in CNE_44665 in zebrafish, mouse, and human. (M) A schematic of site-directed mutagenesis on Hepatocyte nuclear factor 1 (HNF1) (top) and Recombination signal binding protein for immunoglobulin kappa J region (RBPJ) (bottom) putative binding sites from zCNE_44665. (N) A confocal whole-mount image showing the overlap between hes1 Tg(zCNE_44665 ΔHNF1 sdm:GFP) and Tg(EPV.Tp1-Ocu.Hbb2:hmgb1-mCherry). Scale bar 25 μm. O) A confocal whole-mount image showing the overlap between hes1 Tg(zCNE_44665 ΔRBPJ sdm:GFP) and Tg(EPV.Tp1-Ocu.Hbb2:hmgb1-mCherry). Scale bar 25 μm. EXPRESSION / LABELING:
|

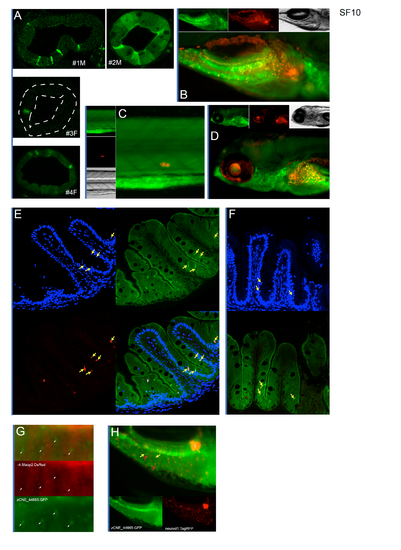
Cloning strategy, cFos injection control, and autofluoresence background. A) Simplified schematic of 4-way LR recombination cloning. Briefly, fragments amplified from a genomic template with primers containing FseI and AscI overhangs are cloned into a 5’ entry vector. A 4-way LR reaction combines the 5' entry containing the putative regulatory element with a middle entry vector containing the minimal cFos promoter (S4 Table) and 3' entry vector with eGFP into a destination vector containing Tol2 insertion sites [125]. B) A cFos control vector was generated to test for potential insertion background expression and the expression capacity of the cFos minimal promoter in IECs as this construct presumably can act as an enhancer trap when inserted into the genome without additional regulatory information. Comprehensive testing of potential insertion influence with this control vector is difficult, however typically no or little expression in IECs was found and none of the cFos control expression fish drove expression patterns that were consistent with the elements tested in the main body of the paper (C-F). While wholemount stereoscopic microscopy of fish containing this control construct did not readily detect IEC GFP expression that we found when testing putative IEC regulatory elements (Figs 4–6). We also performed confocal microscopy on a subset of fish as this is typically more sensitive at identifying localized GFP signal. We note below where limited IEC expression existed in the control lines we profiled, however any IEC expression was not usual and not consistent between control lines. C) Developmental pattern of GFP expression of cFos control line 3m. D) Developmental pattern of GFP expression of cFos control F1 line 7m D’) Cross-section of cFos control line 7m shows light expression in a goblet cell. E) Developmental pattern of GFP expression of cFos control F1 line 9m. E’) Cross-section of cFos control line 9m shows no detectable GFP expression in IECs. F) Developmental pattern of GFP expression of cFos control F1 line 9m. F’) Cross-section of cFos control line 9m shows light GFP expression in IECs. Figures (C-F) are presented on a black background for clarity. Different fish from each line can be represented on different days. Lines 3m shows yolk autofluorescence near the intestine consistent with developmental differences that can disappear variably in developing fish due to environment or genetic background. G-I) Stereomicroscopy images of 7dpf wild-type EK fish without any GFP insertions show the typical autofluoresence signal that can be detected within the intestinal lumen. For each image the number of milliseconds of exposure for the GFP signal is listed. Scale bar 100 μm. |
Additional characterization of regulatory capacity of hes1 zCNE_44665 in transgenic zebrafish. A) 7 dpf cross-section of individual transgenic zebrafish lines for hes1 Tg(zCNE_44665:GFP) show consistent GFP expression in a subset of IECs often at the base of nascent folds. B) Minimal gross overlap can be seen between Notch positive cells in the pancreas and the Tg(zCNE_44665:GFP) signal in 7 dpf zebrafish C) The corpusles of Stannius show high Notch positive signaling and little to no GFP expression from Tg(zCNE_44665:GFP). D) Overlap can be seen between Notch positive cells and Tg(zCNE_44665:GFP) signal in the liver. E) and F) Examples of more apical nuclei in 8 week old cross-section in Tg(zCNE_44665:GFP) and Notch positive cells. G) Whole-mount stereoscopic images of 7 dpf Tg(zCNE_44665:GFP)/Tg(-4.5fabp2:DsRed) shows a large proportion of IECs are DsRed+ enterocytes, however a subset of the IECs not expressing DsRed are GFP+ and are marked by white arrows. H) Whole-mount stereoscopic images of 7 dpf Tg(zCNE_44665:GFP)/Tg(neurod1:TagRFP) show lack of overlap between the hes1 Tg(zCNE_44665:GFP) and enteroendocrine cells. Representative GFP+ cells are marked by a yellow arrow and RFP+ cells are marked by a red arrow. Pancreatic islet marked by i. |