
- Title
-
Zebrafish nephrosin helps host defence against Escherichia coli infection.
- Authors
- Di, Q., Lin, Q., Huang, Z., Chi, Y., Chen, X., Zhang, W., Zhang, Y.
- Source
- Full text @ Open Biol.
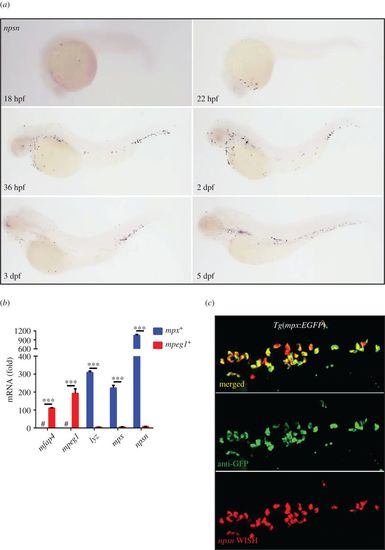
Zebrafish npsn is predominantly expressed in neutrophils. (a) The expression pattern of npsn during zebrafish embryogenesis was initially observed at the rostral blood island at 18 hpf, followed by widespread expression across the site of haematopoiesis in zebrafish. (b) Higher expression of npsn in neutrophils when compared with macrophages. Fluorescent cells were sorted from Tg(mpx:EGFP) and Tg(mpeg1:EGFP), and qRT-PCR was performed to detect the npsn expression, which was highly expressed in neutrophils relative to levels observed in macrophages following adjustment for GFP− cells. Macrophage markers (mfap4 and mpeg1) and neutrophil markers (lyz and mpx) were used as indicators to test the purity of the sorted macrophages and neutrophils; ***p < 0.001. #, undetected. (Mean ± s.e.m., n ≥ 200 per experiment, triplicated). (c) Co-staining for npsn mRNA in mpx+ cells at the posterior blood island (PBI) in Tg(mpx:EGFP) embryos. Double staining for anti-GFP and npsn WISH was performed in Tg(mpx:EGFP) cells at 3 dpf. Most mpx+ neutrophils also expressed npsn mRNA in the PBI. EXPRESSION / LABELING:
|
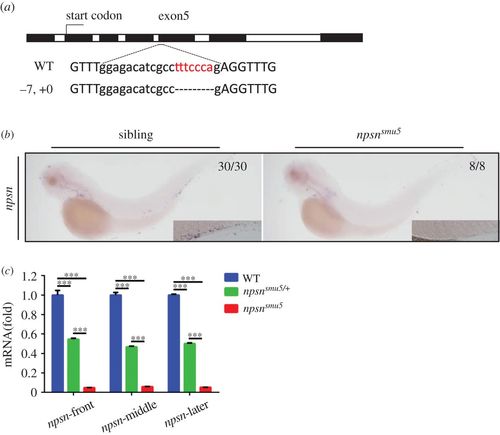
Generation and identification of nps-deficient zebrafish. (a) The CRISPR/Cas9 system was used to generate npsn-knockout zebrafish. The Cas9 target was chosen as exon5 of npsn. Mutants were selected using T7E1 enzyme digestion and confirmed using Sanger sequencing. In F1 founders, a mutant line (−7, +0) containing a frameshift mutation was obtained and retained for follow-up studies. (b and c) Degradation of npsn mRNA in npsnsmu5 mutant embryos. (b) WISH results for npsn mRNA indicated significant decreases in npsnsmu5 mutant embryos at 3 dpf. (c) qRT-PCR results indicating that npsn mRNA expression was downregulated to 5% in npsnsmu5 mutant embryos. (Mean ± s.e.m., n = 20 per experiment, triplicated). Statistical significance was determined by one-way ANOVA. ***p < 0.001. EXPRESSION / LABELING:
PHENOTYPE:
|

npsn deficiency does not affect neutrophil number in zebrafish. (a and a′) WISH analysis of lyz expression and quantification of lyz+ cells in the PBI at 3 dpf (29.5 ± 2.3 versus 26.9 ± 2.7) in WT sibling and npsnsmu5 mutant groups. (Mean ± s.e.m., n = 15 in each group, triplicated). Boxes in the lower right corner outline the magnified PBI regions. (b and b′) WISH analysis of mpx expression and quantification of mpx+ cells in the PBI at 3 dpf (45.9 ± 2.9 versus 38.9 ± 2.9) in WT sibling and npsnsmu5 mutant groups. (Mean ± s.e.m., n = 15 in each group, triplicated). Boxes in the lower right corner outline the magnified PBI regions. (c and c′) Sudan Black staining (SB) and quantification of SB+ cells in the PBI at 3 dpf (57.5 ± 2.7 versus 57.4 ± 5.4) in WT sibling and npsnsmu5 mutant groups). (Mean ± s.e.m., n ≥ 10 in each group, triplicated). Statistical significance was determined by unpaired t-test. n.s., not significant. EXPRESSION / LABELING:
PHENOTYPE:
|

npsn deficiency affects host defence against E. coli infection. (a) The infection site of the zebrafish yolk sac (the red arrow). (b) Scheme showing the experimental procedure used for survival assays. The npsnsmu5 mutants and WT controls were infected with E. coli at 2 dpf via the yolk sac, and the number of surviving larvae was counted daily over the next 5 days. At least three independent experiments were performed using greater than 60 embryos per group. (c) Survival curves of WT embryos challenged with different doses of E. coli. Mortality increased in a dose-dependent manner. (d) Survival curves of npsnsmu5 and WT embryos injected with 100 CFUs of E. coli (WT (n = 57); npsnsmu5 (n = 55) in total). Statistical significance was determined by the log-rank test. *p < 0.05. (e) Bacterial burden of embryos injected with E. coli. Significantly more bacterial cells were observed in npsnsmu5 mutant embryos when compared with those observed in WT controls at 1 and 2 dpi. Data were combined from three individual experiments (n = 50 per group), and statistical significance was determined using the two-way ANOVA with Bonferroni's multiple comparisons adjustment. *p < 0.05. ***p < 0.001. n.s., not significant. #, undetected. (f) Alteration of the inflammatory response in npsnsmu5 embryos at 2 hpi. The relative quantity of inflammatory factors il-1b, il-8 and tnfα was examined by qRT-PCR, and expression levels were adjusted for trauma (PBS-solution injection). (Mean ± s.e.m., n = 30 in each group, triplicated). Statistical significance was determined using the one-way ANOVA with Bonferroni's multiple comparisons adjustment. *p < 0.05. **p < 0.01. ***p < 0.001. n.s., not significant. |

npsn deficiency affects neutrophil recruitment to bacteria. (a) The infection site of the zebrafish muscle (the red arrow). DsRed+ E. coli were injected subcutaneously over one somite into WT and npsnsmu5 mutant embryos with Tg(mpx:eGFP) background, and images were captured at 0.5, 3 and 24 hpi. All images are maximum-intensity projection at an interval of 2 µm. The white triangle indicated the neutrophil with phagosomes. (b) Quantification of recruited mpx:eGFP+ neutrophil numbers (green bar) and phagocytosing neutrophil numbers (red net bar) in the infection site at each time point in bacterial injected WT and npsnsmu5 mutants. Average numbers with means in WT and npsnsmu5 mutant groups at 0.5, 3, 24 hpi (green bar: 19.7 ± 2.6 versus 21.7 ± 0.8; 28.6 ± 4.1 versus 47.0 ± 2.3; 17.5 ± 4.8 versus 42.8 ± 7.5); (red net bar: 16.9 ± 2.6 versus 16.83 ± 1.2; 26.4 ± 3.6 versus 39.8 ± 2.1; 5.9 ± 2.2 versus 8.2 ± 1.1). (Mean±s.e.m., n ≥ 6 in each group, triplicated). Statistical significance was determined using the two-way ANOVA with Bonferroni's multiple comparisons adjustment. **p < 0.01. ***p < 0.001. n.s., not significant. (c) Bacterial burden of embryos at 24 hpi in npsnsmu5 mutant embryos and WT controls. (Mean±s.e.m., n = 50 in each group, triplicated). Statistical significance was determined using the unpaired t-test. ***p < 0.001. |
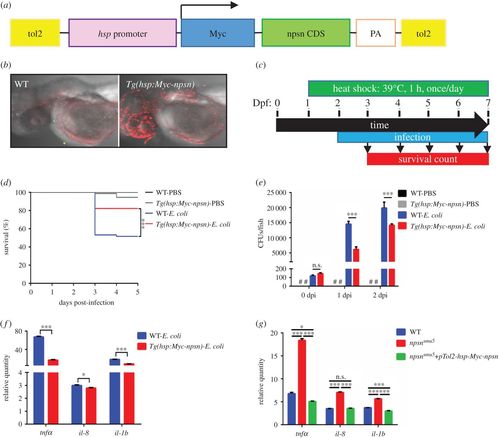
npsn overexpression enhances host response against E. coli infection. (a) Construction of the Tg(hsp:Myc-npsn) transgenic plasmid. npsn-CDS (green bar) was inserted behind the hsp promoter and a Myc tag. (b) Anti-Myc staining of the Tg(hsp:Myc-npsn) and WT embryos. (c) Scheme showing the experimental procedure used for the survival assays. Tg(hsp:Myc-npsn) and WT embryos were heat shocked at 39°C for 1 h at 1 day prior to infection. Embryos were infected with E. coli at 2 dpf via the yolk sac and heated to 39°C for 1 h daily, and the number of surviving larvae was counted daily over the next 5 days. (d) Survival curves for Tg(hsp:Myc-npsn) and WT embryos following injection with 100 CFUs of E. coli (WT (n = 60); Tg(hsp:Myc-npsn) (n = 60)). Statistical significance was determined using the log-rank test. ***p < 0.001. (e) Bacterial burden of embryos injected with E. coli. Less bacterial cells in Tg(hsp:Myc-npsn) at 1 and 2 dpi than in WT. Data were combined from three individual experiments (n = 50 per group), and statistical significance was determined using the two-way ANOVA with Bonferroni's multiple comparisons adjustment. ***p < 0.001. n.s., not significant. #, undetected. (f) Alteration of the inflammatory response in Tg(hsp:Myc-npsn) embryos at 2 hpi. The relative quantity of tnfα, il-8 and il-1b was examined by qRT-PCR, and expression levels were adjusted for trauma (PBS-solution injection). (Mean±s.e.m., n = 30 in each group, triplicated). Statistical significance was determined using the two-tailed Student's t-test. *p < 0.05. ***p < 0.001. (g) The altered expression of inflammatory cytokines could be rescued by npsn overexpression. The relative quantity of tnfα, il-8 and il-1b was examined by qRT-PCR, and expression levels were adjusted for trauma (PBS-solution injection). (Mean±s.e.m., n = 30 in each group, triplicated). Statistical significance was determined using the one-way ANOVA with Bonferroni's multiple comparisons adjustment. *p < 0.05. ***p < 0.001. n.s., not significant. |

Less neutrophils are recruited at the infection in Tg(hsp:Myc-npsn) embryos. (a) The infection site of the zebrafish muscle (the red arrow). DsRed+ E. coli were injected subcutaneously over one somite into WT and Tg(hsp:Myc-npsn) embryos with Tg(mpx:eGFP) background, and images were captured at 0.5, 3 and 24 hpi. All images are maximum-intensity projection at an interval of 2 μm. White triangles indicated neutrophils with phagosomes. (b) Quantification of recruited mpx:eGFP+ neutrophil numbers (green bar) and phagocytosing neutrophil numbers (red net bar) in the infection site at each time point in bacterial injected WT and Tg(hsp:Myc-npsn) embryos. Average numbers with means in WT and Tg(hsp:Myc-npsn) groups at 0.5, 3, 24 hpi (green bar: 41.0 ± 2.0 versus 32.8 ± 1.5; 61.2 ± 3.1 versus 48.4 ± 3.0; 47.8 ± 4.5 versus 33.0 ± 3.7); (red net bar: 33.0 ± 3.3 versus 28.2 ± 81.3; 57.6 ± 3.0 versus 44.3 ± 3.7; 2.2 ± 0.6 versus 2.4 ± 0.7). (Mean±s.e.m., n ≥ 6 in each group, triplicated). Statistical significance was determined using the two-way ANOVA with Bonferroni's multiple comparisons adjustment. *p < 0.05. **p < 0.01. ***p < 0.001. n.s., not significant. (c) Bacterial burden of embryos at 24 hpi in Tg(hsp:Myc-npsn) embryos and WT controls. (Mean±s.e.m., n = 50 in each group, triplicated). Statistical significance was determined using the unpaired t-test. *p < 0.05. EXPRESSION / LABELING:
PHENOTYPE:
|

Generation and characterization of the Tg(npsn:EGFP)smu7 line. A. Construction of the Tg(npsn:EGFP)smu7 transgenic plasmid. A 2-kb upstream sequence of the zebrafish npsn gene (pink bar; referred to as the npsn promoter) was cloned and inserted prior to the GFP gene (green bar) and flanked by the two TP sites (yellow bar) in the Tol2 transgenic plasmid. B. The expression pattern of GFP signals in Tg(npsn:EGFP)smu7 at 3 dpf. C. Double fluorescent staining for GFP and npsn WISH in Tg(npsn:EGFP)smu7 at 3 dpf. (D–F) and (D’–F’). Inter-crossing of Tg(npsn:EGFP)smu7 and Tg(lyz:DsRed) lines to reveal overlapping populations. npsn+ cells overlapped 100% in the thymus (D and D’), 87.09 ± 9.45% in the AGM (E and E’), and 90.05 ± 2.85% in the PBI (F and F’) with mpx+ cells. White arrows indicate non-overlapping signals. G. The npsn promoter drives expression specifically in neutrophils. GFP+ cells sorted from Tg(npsn:EGFP)smu7 and Tg(mpx:EGFP). qRT-PCR showed neutrophil markers (lyz, mpx, and npsn) expressed at higher levels in npsn+ cells as compared with levels observed in mpx+ cells. The # represents “undetected”, [Mean ± SEM, n ≥ 200 in each group, triplicated], and statistical significance was determined using the two-tailed Student's t test. ***p < 0.001. |

Decreased npsn mRNA levels in CRISPER/Cas9-mediated npsn-knockout lines. A. The other Cas9 target was chosen on npsn exon6 to obtain a (−0, +1) mutant (npsnsmu6) containing a frameshift mutation. B. npsn WISH results showed significantly decreased npsn mRNA in npsnsmu5 mutant embryos at 24 hpf, 36 hpf, and 2 dpf. C. npsn WISH results showed npsn expression was also significantly decreased in npsnsmu6 embryos. |