
- Title
-
SERCA directs cell migration and branching across species and germ layers
- Authors
- Bower, D.V., Lansdale, N., Navarro, S., Truong, T.V., Bower, D.J., Featherstone, N.C., Connell, M.G., Al-Alam, D., Frey, M.R., Trinh, L.A., Fernandez, G.E., Warburton, D., Fraser, S.E., Bennett, D., Jesudason, E.C.
- Source
- Full text @ Biol. Open

SERCA inhibition disrupts Drosophila air sac via cell-autonomous defects in epithelial migration and proliferation. (A) serca RNAi disrupts airway morphogenesis. Wild-type air sac (left), with GFP-labeled respiratory epithelium. serca RNAi, driven by breathless in respiratory epithelium, results in a stunted (right) or absent air sac. Scale bar: 25 μm. (Also see Fig. S2.) (B) serca RNAi alters the position of cells expressing distal marker, escargot (red), which normally are positioned only at the air sac tip (top panels). In serca RNAi mutants (bottom), escargot-expressing cells are retained also in the malformed air sac stalk (arrows, right). breathless-dependent GFP expression identifies the wild-type air sac (top row, left) and abnormal serca RNAi epithelial air sac (bottom, left). Scale bar: 20 μm. (C) serca-deficient cells are necessary within the air sac to disrupt budding. FLP-recombinase to generate serca RNAi clones (green) shows that if no such clones are induced in the air sac it forms normally (top, epithelium in red), whereas when flipped cells populate the air sac, it fails to develop properly (bottom). Scale bar: 25 μm. (D) Flip-out serca RNAi cells have a cell-autonomous migration defect. Plot shows proportions of flipped cells localized to the tip, middle and stalk thirds of the air sac for control and serca RNAi clones. serca RNAi cells are relatively excluded from the air sac tip and restricted more to the stalk. (E) Flip-out serca RNAi cells have a cell-autonomous proliferation defect. Plot of number of cells per contiguous group of flipped cells for control and serca RNAi clones. Median (interquartile range) of phosphohistone H3 (PH3)-positive cells per air sac: 2.5 (1-4) control vs 0 (0-1) serca RNAi (n=18 per group; P<0.001, Mann–Whitney). |

SERCA regulates cell migration to control budding, even in the absence of proliferation. (A-E) SERCA blockade reversibly disrupts Drosophila tracheogenesis and PMA rescues this. Whole mount Drosophila embryos at stage 15-16 are viewed from the lateral aspect, anterior left, and the 2A12 antibody stains for tracheal lumen protein following the indicated treatments. (A) DMSO-treated controls display orderly tracheal branches. (B) 20 µM CPA disrupts branching, resulting in gaps in the dorsal trunk (arrowheads) and subsidiary branches (arrows). (C) CPA washout at stage 12 results in fewer breaks (solid arrowhead) and undulating branches with extended sprouts (open arrowheads). (D) PMA with CPA rescues tracheal budding defects. Occasionally, an embryo treated with CPA+PMA or one from which CPA was washed out exhibits a phenotype of excess tracheal cell migration (see Movie 8). (E) Severity of phenotypes was scored for each treatment. Both washout and PMA rescue versus CPA alone significantly reduce the proportions of embryos in higher severity groups (P<0.001; Chi-squared; n>70 per treatment). (F-I) Live imaging shows SERCA is necessary for airway cells to converge during completion of Drosophila tracheogenesis. (F-G) The trajectories (white arrows) and yellow-to-red migration paths are shown for individual cells that form the tracheal lateral trunk from stage 14 to early 16. The displacements shown represent cell movement over 100 min. (F) Cells from adjacent segments in DMSO-treated wild-type embryos converge. (G) During SERCA blockade, tracheal cells lack active migration and slightly diverge as the embryo develops. (H) For pairs of tracheal cells in adjacent segments, the direction of travel of one cell relative to the other was calculated, and a vector was plotted for each pair to compare the movements of all pairs from each treatment together, demonstrating the angles of convergence (controls) or divergence (CPA-treatment) of these cells. (I) The plot shows mean and standard deviation of the convergence, or % reduction in starting separation, of pairs of adjacent cells. Controls reduce their starting separation 58%, while CPA treatment blocks active migration and the cells diverge (the mean is negative). Scale bars: 25 µm throughout. |
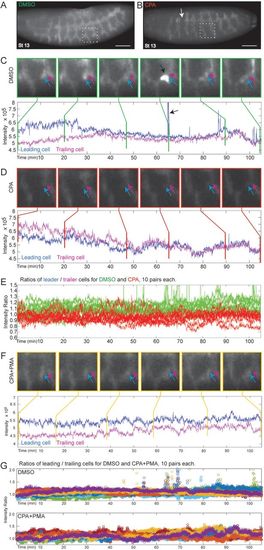
SERCA regulates cell migration and budding by maintaining higher Ca2+ levels in ‘leader’ versus ‘trailer’ cells. (A,B) Btl:GCamp3 embryos treated with DMSO, CPA, or CPA+PMA were imaged between stage 13 and 16, and images were reconstructed to analyze the Ca2+ levels in tracheal cells. Shown are 3D reconstructed images of stage 13 embryos treated with (A) DMSO or (B) CPA (arrow indicates discontinuous trunk). Insets mark segments tracked in (C) and (D). Scale bars: 50 µm. (C-D,F) Inset images of tracked cells from DMSO- (C), CPA- (D), and CPA+PMA-treated (F) embryos. ‘Leader’ cells (blue arrow) that migrate from adjacent segments and fuse to form the lateral trunk and ‘trailer’ cells (magenta arrow) behind them were tracked over the time course and their Ca2+ levels quantified and plotted below the panel of images. Vertical lines mark the time points corresponding to each image. (C) In controls, there is a Ca2+ level differential whereby ‘leader’ cells have consistently higher Ca2+ levels than ‘trailers’, particularly early when the cells are migrating. After fusion, ‘leaders’ periodically display surges of Ca2+ (black arrows; also green spikes in E and spikes in top panel of G). (D) In CPA-treated embryos, migration is lost so the lateral trunk remains discontinuous, and ‘leaders’ have lower Ca2+ levels than ‘trailers’ during the time they should be migrating. Thus the Ca2+ level differential is reversed. (F) CPA+PMA co-treatment reinstates the higher Ca2+ level in ‘leaders’ and rescues migration. (E,G) For each treatment, the ratio of intensities of ten pairs of cells (leader/trailer) was plotted. (E) The DMSO ratios (green) average >1. SERCA inhibition (red, ratio <1) inverts this. (G) The DMSO- and CPA+PMA-treated embryos overlap (ratios >1), so each was plotted separately with different colors for individual ratios. DMSO-treated embryos show Ca2+ spikes following trunk fusion. While CPA+PMA restores branching, Ca2+ spikes are absent or only seen much later (Movie 5). |

Live Ca2+ imaging shows that impulses propagate the Drosophila tracheal network. Btl:GCamp3 embryos were imaged in 3D+time (3 sec time resolution) from stage 13 to 16 using two-photon light-sheet microscopy. (A,B) Time-lapse imaging of two control embryos at stage 16 reveal Ca2+ pulses propagating through electrically coupled cells once the tracheal network has fused, such as between adjacent transverse connectives via the dorsal trunk (A), or bidirectionally (B) (follow arrows in numbered sequence). The time points shown are (A) 21 and (B) 9 sec apart. Scale bars: 50 µm. (C) At 20 ms time resolution, a typical Ca2+ spike shows a fast upstroke and slower decay. (D) The mean Ca2+ spiking frequency and SEM for control, CPA-treated, and CPA+PMA-treated embryos at each stage are plotted (n>3; mean±s.e.m.). Spike frequency increases with embryo age. Compared to controls, the frequency of Ca2+ impulses at later stages is diminished by SERCA blockade, even in the presence of the PKC activator PMA. (E) Histograms of Ca2+ spike duration at stages 13-14 (left) and 15-16 (right) for embryos treated with DMSO (green), CPA (red) and CPA+PMA (yellow). In contrast to DMSO controls, embryos treated with CPA±PMA feature two types of Ca2+ pulse: (1) normal duration (clustered around 18 sec) and (2) prolonged with slow decay (see Movie 7). |

SERCA function controls the rates of mesodermal migration and budding. (A) Wild-type 28 hpf Tg(kdrl:eGFP) zebrafish embryo demonstrates intersomitic vasculature seen by wide field (top, scale bar: 200 μm) and higher magnification below (scale bar: 100 μm). For A-H, images are inverted for improved clarity. (B-H) Paired confocal images show 3D reconstructions of the 14th-15th and 20th intersomitic vessels from embryos treated with (B) DMSO, (C) 1.25 µM CPA, (D) 5 µM CPA, (E) 10 µM CPA, (F) 20 µM CPA (G) 10 µM CPA washed out after 2 h, and (H) 20 µM CPA washed out after 2 h. Varying CPA dose results in dose-dependent reduction in vascular budding until at 20 μM, budding is reversibly suspended. Budding resumes after CPA washout. Scale bar: 50 µm for all images. Red arrows indicate distal-most positioning of nuclei in B and E (see caption for I,J). (I,J) Plots show, for each treatment, the collective number of branches (red lines are medians) on vessels 13-16 which form in the middle of the treatment (I) and the proportion of branches with cell nuclei at tip positions (J): compare the positions of nuclei (arrowed) in B versus E. Error bars in J indicate the s.e.m. In a parallel dose-dependent manner, CPA reduces branch numbers (I) and distal migration of endothelial cells (J) with resumption of branching and migration upon CPA washout. (K-M) Vessel path length (K), linear vessel height (L), and the total number of intersomitic vessels per embryo (M) measured in 3D show similar CPA dose- and time-dependent reductions in branching. Data in K and L are shown for the 20th intersomitic vessel, which forms during the treatment (red lines are medians). |
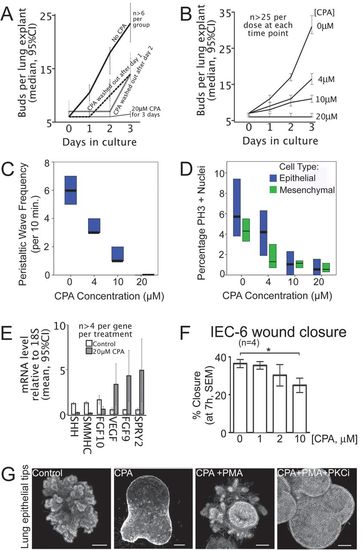
SERCA function controls the onset and rate of lung branching. (A) SERCA function dictates the onset of new buds. Plot of lung bud count versus time in culture for E13 rat lung explants shows the budding rate in controls (no CPA), lack of budding with 20 μM CPA, and resumption of budding when CPA is removed. (B) SERCA function titrates budding rate. Bud count plotted against days in culture. The normal accretion of buds is shown in the absence of CPA (0 μM). Escalating the CPA dose controls the budding rate. At 20 μM, branching is arrested. (C) The frequency of airway peristaltic waves decreases with escalating CPA dose, with statistical significance between each treatment group (P<0.05, Mann-Whitney U test). Median and interquartile range (IQR) are plotted, n>10 for each treatment. (D) Proliferation of lung epithelial and mesenchymal cells decreases with escalating CPA dose, with statistical significance between treatments for each cell type, except 10 µM and 20 µM are equivalent (P<0.05, Mann-Whitney U test). Median and IQR of PH3 positive nuclei are plotted, n>24 for each treatment. (E) SERCA blockade is associated with downregulation of lung morphogens SHH, FGF10, and SMMHC (smooth muscle myosin heavy chain), and significant upregulation of SPRY2, FGF9 and VEGF (qRT-PCR). Error bars indicate 95% confidence interval. (F) SERCA inhibition impairs epithelial cell migration. Plot of percentage closure at 7 h (mean±s.e.m.) of a standardized wound in a confluent monolayer of IEC-6 intestinal epithelial cells treated with 0, 1, 2, or 10 μM CPA. Wound closure is significantly reduced by 10 μM CPA (*P<0.05, one-way ANOVA and Bonferroni multiple comparisons test). (G) Epithelial SERCA blockade halts budding and is rescued by PKC activation. Epithelial tips isolated from E12.5 murine lungs bud in Matrigel with FGF10. Control epithelial tips bud extensively (left panel). 10 μM CPA abolishes budding, despite co-incubation with FGF10 (2nd panel). Budding is rescued by co-treatment with PKC activator (100 nM PMA) (3rd panel). Budding is re-inhibited by PKC inhibition (2.22 μM Bisindolylmaleimide I Hydrochloride), demonstrating that PMA rescue is mediated by PKC (right panel). Scale bars: 100 μm |