
- Title
-
Screening in larval zebrafish reveals tissue-specific distributions of fifteen fluorescent compounds
- Authors
- Yao, Y., Sun, S., Fei, F., Wang, J., Wang, Y., Zhang, R., Wu, J., Liu, L., Liu, X., Cui, Z., Li, Q., Yu, M., Dang, Y., Wang, X.
- Source
- Full text @ Dis. Model. Mech.

Identification of red fluorescent compounds with tissue-specific distributions in zebrafish larvae. (A) An illustration of the screening process. (B) Whole mount lateral views of the zebrafish larvae at 6 dpf with tissue-specific distributions of the red fluorescent compounds. i: DMSO-treated zebrafish as control. Scale bars: 100 μm. |

Purpurin, lucidin and 3-hydroxy-morindone label bones in zebrafish larvae. (A) Lateral and top views of the purpurin-treated zebrafish larva at 14 dpf, and the chemical structure of purpurin. Lateral view of whole zebrafish (top panel), the top view of the head (lower left panel), and the lateral view of the spine (lower right panel). Scale bars: 100 μm. (B) Lateral and top views of the lucidin-treated zebrafish larva at 14 dpf, and the chemical structure of lucidin. Lateral view of whole zebrafish (top panel), the top view of the head (lower left panel), and the lateral view of the spine (lower right panel). Scale bars: 100 μm. (C) Lateral and top views of the 3-hydroxy-morindone-treated zebrafish larva at 14 dpf, and the chemical structure of 3-hydroxy-morindone. Lateral view of whole zebrafish (top panel), the top view of the head (lower left panel), and the lateral view of the spine (lower right panel). Scale bars: 100 μm. (D) Lateral and top views of the Alizarin Red and Alcian Blue-stained zebrafish larva at 14 dpf. Lateral view of whole zebrafish (top panel), the top view of the head (lower left panel), and the lateral view of the spine (lower right panel). Scale bars: 100 μm. (E) Lateral views of the wild-type and dexamethasone-treated zebrafish larva at 6 dpf. Scale bars: 100 μm. (F) Lateral views of purpurin-treated Tg(flk1:EGFP) zebrafish larvae at 6 dpf. Scale bars: 100 μm. |
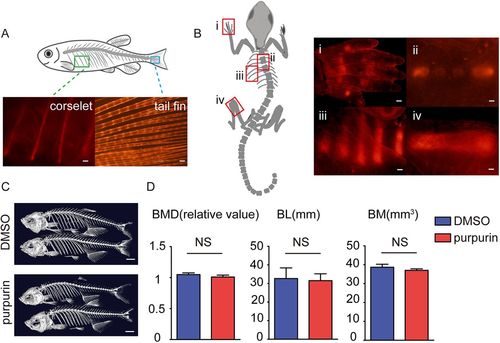
Purpurin labels bones in adult zebrafish and mice without significantly affecting bone density and mass. (A) Images of the purpurin-stained corselet and tail fin in an adult zebrafish. Scale bars: 100 μm. (B) Images of the purpurin-stained digital bone (i), spine (ii), rib (iii) and femur (iv) of a P3 mouse. Scale bars: 300 μm. (C) Three-dimensional bone reconstruction of micro-CT scans on the adult zebrafish treated with DMSO and purpurin for 3 weeks. Scale bars: 1 cm. (D) The statistical results of bone mineral density (BMD; n=12), body length (BL; n=12) and bone mass (BM; n=12). Values are means±s.e.m., with differences determined by Student's t-test. NS, not significant. |
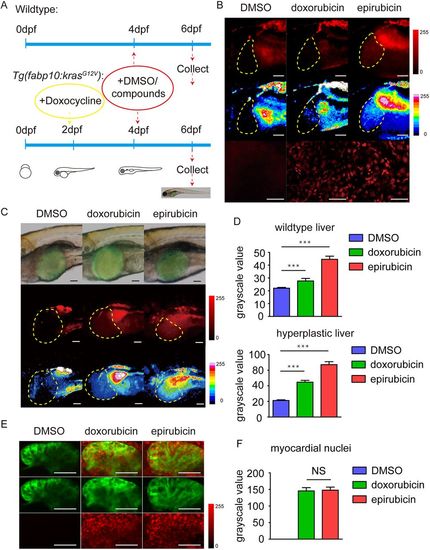
Distributions of epirubicin and doxorubicin in zebrafish livers and hearts. (A) The procedures for adding compounds and chemical inducers in wild-type and transgenic zebrafish larvae. (B) Doxorubicin and epirubicin in wild-type zebrafish liver. The top-row panels are the original images taken using the microscope under the red fluorescence channel. The middle-row panels are the images taken with 16 pseudocolours applied to distinguish different densities of the compounds. The bottom-row panels are the confocal images taken to show the nuclear distributions of the compounds in the liver. Scale bars: 50 μm. (C) Doxorubicin and epirubicin in the tumourigenic zebrafish liver with krasG12V over-expression. The top-row panels are the merged images of the bright-field and green fluorescent channel. The middle-row panels are the original images of the red fluorescent channel. The bottom-row panels are the images with 16 pseudocolours applied to distinguish different densities of the compounds. Scale bars: 50 μm. (D) Statistics of the fluorescence intensity values of wild-type and hyperplastic livers from DMSO-, doxorubicin- and epirubicin-treated zebrafish larvae (n=16). The values are means±s.e.m., with statistical differences being determined by one-way ANOVA, ***P<0.001. (E) Doxorubicin and epirubicin in wild-type zebrafish hearts. The green channel displayed the images of Tg(myl7:EGFP) zebrafish hearts at 6 dpf, and the red channel displayed doxorubicin or epirubicin in cells. Scale bars: 50 μm. (F) Statistics of the red fluorescence intensities in myocardial nuclei from DMSO-, doxorubicin- and epirubicin-treated zebrafish larvae (n=16), means±s.e.m., with statistical differences being determined by one-way ANOVA. NS, no significant changes. |
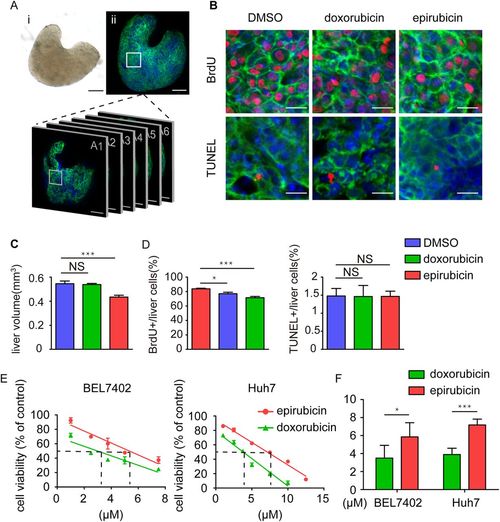
Effects of doxorubicin and epirubicin on proliferation and apoptosis in the hyperplastic livers of transgenic zebrafish larvae. (A) An example of the whole liver after dissection in both bright-field and fluorescent images. Scale bars: 50 μm. (B) Representative images of BrdU and TUNEL staining in the DMSO-, doxorubicin- and epirubicin-treated zebrafish liver with EGFP-krasG12V over-expression. Scale bars: 10 μm. (C) Statistics of the DMSO-, doxorubicin- and epirubicin-treated liver size from the transgenic larvae (n=16). The values are means±s.e.m., with statistical differences being determined by one-way ANOVA, ***P<0.001; NS, not significant. (D) Statistics of BrdU and TUNEL labelling in the DMSO-, doxorubicin- and epirubicin-treated zebrafish liver with EGFP-krasG12V over-expression (n=16). The values are means±s.e.m., with statistical differences being determined by one-way ANOVA; *P<0.05, ***P<0.001; NS, not significant. (E) The cytotoxicity of doxorubicin and epirubicin in the liver cancer cells BEL7402 and Huh7 using the MTT assay. The dashed lines are the IC50 values for each compound. (F) The statistical results of the IC50 of doxorubicin and epirubicin in the liver cancer cells BEL7402 and Huh7. The values are means±s.e.m., with statistical differences being determined by Student's t-test; *P<0.05, ***P<0.001. |
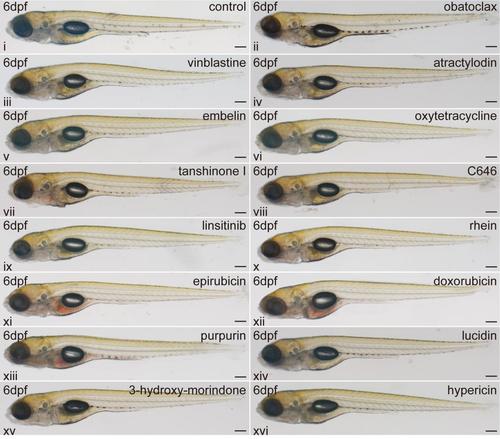
Brightfield images of the compound-treated zebrafish larvae at 6dpf Scale bar: 100μm |
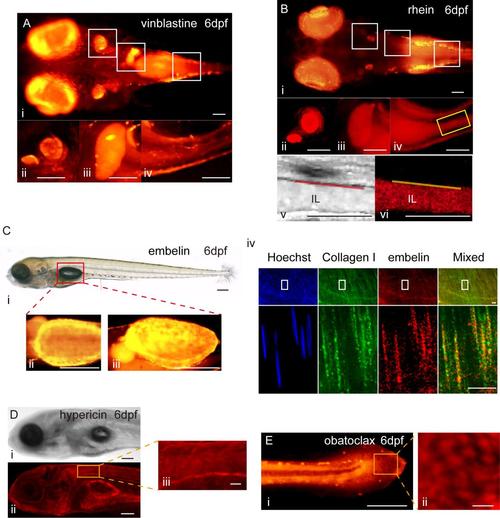
High magnification images of vinblastine-, rhein-, embelin-, hypericin-, and obatoclax-treated zebrafish larvae. A. High magnification images of vinblastine-treated zebrafish larvae. i:Top view of vinblastine-treated zebrafish larvae at 6dpf. ii-iv:The otolith, gall bladder and intestine of vinblastine-treated zebrafish larvae at 6dpf. Scale bar:50μm. B. High magnification imagesof rhein-treated zebrafish larvae. i:Top view of rhein-treated zebrafish larvae at 6dpf. ii-iv:The otolith, gall bladder and intestine of rhein-treated zebrafish larvae at 6dpf. v-vi: the brightfield and fluorescent images about the rheinin the intestine. IL: intestinal lumen. Scale bar: 50μm. C. Distribution of embelinin larval and adult swim bladders. i: brightfield image of embelin-treated zebrafish larvae with the swim bladderat6dpf. ii-iii: the ventral and lateral fluorescent views of swim bladder from embelin-treated zebrafish larvae at 6dpf. Scale bar:100μm.iv: co-staining of embelin and collagen I immunofluorescence in the adult swim bladder. Scale bar: 10μm. D. A single confocal slice of hypericin-treated larvae from the lateral view. i-ii: Scale bar:100μm.iii: Scale bar: 20μm. E. High magnification image of the tail of obatoclax-treated larvae from the lateral view. i: Scale bar:100μm.ii: Scale bar: 10μm. |