
- Title
-
Septins restrict inflammation and protect zebrafish larvae from Shigella infection
- Authors
- Mazon-Moya, M.J., Willis, A.R., Torraca, V., Boucontet, L., Shenoy, A.R., Colucci-Guyon, E., Mostowy, S.
- Source
- Full text @ PLoS Pathog.

S. flexneri infection of the zebrafish hindbrain ventricle. A. Cartoon of zebrafish larva (3 dpf) showing localization of neutrophils prior to infection (red) and the site of S. flexneri M90T (green) injection in the HBV. B. Survival curves of larvae infected with a low (≤ 3 x 10³ CFU) or high (≥ 1 x 10⁴ CFU) dose of S. flexneri M90T. Pooled data from 5 independent experiments per inoculum class using at least 15 larvae per experiment. Significance testing performed by Log Rank test. ***, P<0.001. C. Enumeration of bacteria at 0, 24, or 48 hpi from surviving larvae infected with a low (open circles) or high (closed circles) dose of S. flexneri M90T. Pooled data from 5 independent experiments per inoculum class using up to 3 larvae per treatment. Circles represent individual larvae, and only larvae having survived the infection (thus far) included here (i.e., dead larvae not homogenised for counts). Mean ± SEM also shown (horizontal bars). Significance testing performed by Student’s t test. ***, P<0.001. D. Representative images of larvae infected in the HBV with low or high dose of GFP-S. flexneri M90T. For each dose, the same larva was imaged at 0, 24, and 48 hpi using a fluorescent stereomicroscope. Scale bars, 100 μm. E-F. Representative frames extracted from in vivo time-lapse confocal imaging of lyz:dsRed larvae (3 dpf, red neutrophils) injected in the HBV with a (E) low dose or (F) high dose of GFP-S. flexneri M90T. First frame 20 mpi, followed by frames at 3, 7, and 11 hpi. Maximum intensity Z-projection images (2 μm serial optical sections) are shown. Scale bars, 50 μm. See also S2 and S3 Videos. EXPRESSION / LABELING:
PHENOTYPE:
|

Sept15 morphants show increased susceptibility to S. flexneri infection. A. Representative western blot of extracts from larvae injected with control (Ctrl) or Sept15 morpholino (Mo) using antibodies against GAPDH (as control) or SEPT7. B. Survival curves of Ctrl or Sept15 morphants infected with S. flexneri M90T (low dose). Pooled data from 3 independent experiments per treatment using at least 15 larvae per treatment. Significance testing performed by Log Rank test. **, P<0.01. C. Enumeration of bacteria at 0, 24, or 48 hpi from Ctrl (open circles) or Sept15 (closed circles) morphants infected with S. flexneri M90T (low dose). Half-filled circles represent enumerations from larvae at time 0 and are representative of inoculums for both conditions. Pooled data from 3 independent experiments using up to 3 larvae per treatment. Circles represent individual larvae, and only larvae having survived the infection (thus far) included here (i.e., dead larvae not homogenised for counts). Mean ± SEM also shown (horizontal bars). Significance testing performed by Student’s t test. *, P<0.05; ***, P<0.001. D. Representative images of larvae injected with Ctrl or Sept15 Mo and infected in the HBV with GFP-S. flexneri M90T (low dose). For each treatment, the same larva was imaged at 0, 24, and 48 hpi using a fluorescent stereomicroscope. Scale bars, 100 μm. See also S4 and S5 Videos. E-F. Representative frames extracted from in vivo time-lapse confocal imaging of lyz:dsRed larvae (3 dpf, red neutrophils) injected with (E) Ctrl or (F) Sept15 Mo and infected in the HBV with GFP-S. flexneri M90T (low dose). First frame 20 mpi, followed by frames at 6, 15, and 20 hpi. Maximum intensity Z-projection images (2 μm serial optical sections) are shown. Scale bars, 50 μm. See also S6 and S7 Videos. EXPRESSION / LABELING:
PHENOTYPE:
|
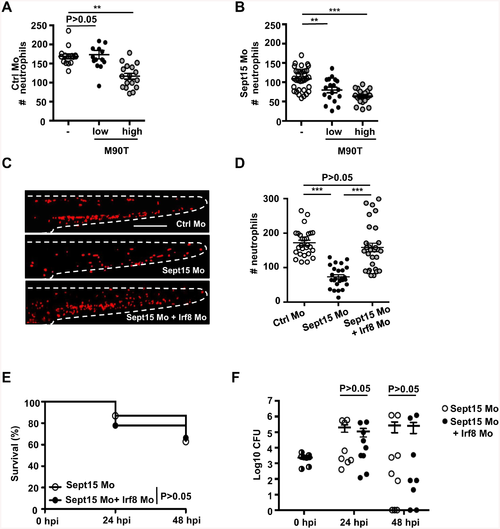
S. flexneri induces neutrophil death in Sept15 morphants. A-B. Quantification of neutrophils in lyz:dsRed larvae injected with (A) Ctrl or (B) Sept15 morpholino (Mo), uninfected (open circles) or infected for 6 h with a low (closed circles) or high (grey circles) dose of S. flexneri M90T, from 4 or more larvae per treatment from 3 independent experiments. Circles represent individual larvae. Mean ± SEM also shown (horizontal bars). Significance testing performed by ANOVA with Bonferroni posttest. **, P<0.01; ***, P<0.001. C. Representative images of lyz:dsRed larvae injected with Ctrl, Sept15, or Sept15 + Irf8 Mo. Scale bar, 250 μm. D. Quantification of neutrophils in lyz:dsRed larvae injected with Ctrl (open circles), Sept15 (closed circles), or Sept15 + Irf8 (grey circles) Mo. Circles represent individual larvae. Mean ± SEM also shown (horizontal bars). Significance testing performed by ANOVA with Bonferroni posttest. ***, P<0.001. E. Survival curves of Sept15 or Sept15 + Irf8 morphants infected with S. flexneri M90T (low dose). Pooled data from 3 independent experiments per treatment using at least 15 larvae per treatment. Significance testing performed by Log Rank test. F. Enumeration of bacteria at 0, 24, or 48 hpi from Sept15 (open circles) or Sept15 + Irf8 (closed circles) morphants infected with S. flexneri M90T (low dose). Half-filled circles represent enumerations from larvae at time 0 and are representative of inocula for both conditions. Pooled data from 3 independent experiments per inoculum class using up to 3 larvae per treatment. Circles represent individual larvae, and only larvae having survived the infection (thus far) included here (i.e., dead larvae not homogenised for counts). Mean ± SEM also shown (horizontal bars). Significance testing performed by Student’s t test. EXPRESSION / LABELING:
PHENOTYPE:
|
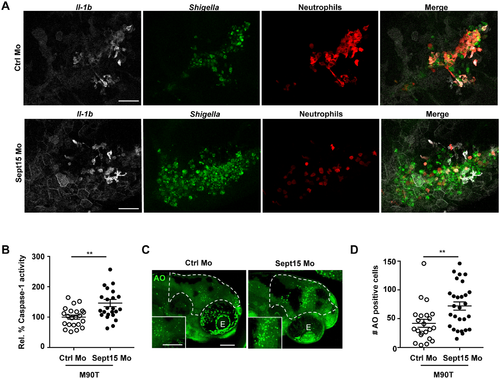
Sept15 restricts the inflammatory response in vivo. A. Representative frames extracted from in vivo time-lapse confocal imaging of Tg(il-1b:GFP-F) x Tg(lyz:dsRed) larvae (3 dpf) injected with Ctrl or Sept15 Mo and infected in the HBV with Crimson-S. flexneri M90T (low dose) at 19 hpi. Maximum intensity Z-projection images (2 μm serial optical sections) are shown. Scale bars, 50 μm. See also S8 and S9 Videos. B. Relative % of Caspase-1 activity levels measured in Ctrl and Sept15 morphants infected for 6 h with ~5 x 10³ CFU of S. flexneri M90T. Mean±SEM from 3 independent experiments per treatment using 5–10 larvae per experimental group. Significance testing performed by Student’s t test. **; P<0.01. C. Representative images of Ctrl and Sept15 morphants (Mo) infected with S. flexneri M90T in the HBV and stained for acridine orange. Dotted line shows the area where cells were quantified (i.e. the infected HBV). Scale bars, 100 μm. E, eye. D. Number of acridine orange (AO) positive cells counted in the HBV of Ctrl or Sept15 morphants 6 hpi with S. flexneri M90T. Significance testing performed by Student’s t test. **, P<0.001. Pooled data from 3 independent experiments per treatment using at least 6 larvae per treatment. EXPRESSION / LABELING:
PHENOTYPE:
|

S. flexneri infection of the zebrafish hindbrain ventricle. A. Transverse section of larvae (3 dpf) infected in the HBV with S. flexneri M90T (low dose) for 6h. Arrow indicates the localisation of the bacteria inside the ventricle. Scale bar, 50 μm. E, eye; M, midbrain ventricle. B. Survival curves of larvae infected with low (≤ 3 x 10³ CFU) or high (≥ 1 x 10⁴ CFU) inoculum of T3SS- S. flexneri (ΔmxiD strain) using at least 15 larvae per experiment. Significance testing performed by Log Rank test. C. Enumeration of bacteria at 0, 24, or 48 hpi from larvae infected with low (open circles) or high (closed circles) dose of S. flexneri M90T using up to 3 larvae per treatment. Circles represent individual larvae. Mean ± SEM also shown (horizontal bars). Significance testing performed by Student’s t test. **, P<0.01; ***, P<0.001. Note bacterial load does not significantly decrease in highly infected fish because of the high bacteria:leukocyte ratio and thus more time is required to clear the bacterial burden. D. Frames extracted from in vivo time-lapse confocal imaging of mpeg1:G/U:mCherry x mpx:GFP larvae (3 dpf) injected in the HBV with low dose of Crimson-S. flexneri. First frame 20 mpi, followed by frames at 1, 3, and 12 hpi. Maximum intensity Z-projection images (2 μm serial optical sections) are shown. Scale bars, 50 μm. See also S1 Video. |
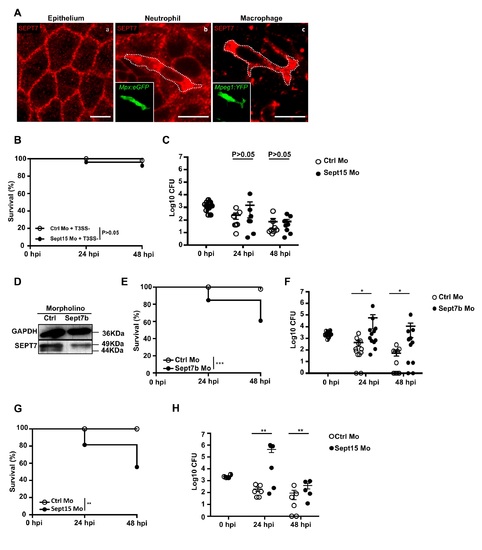
Sept15 and Sept7b morphants show increased susceptibility to S. flexneri infection. A. Immunostaining of zebrafish larvae at 3 dpf with antibody against SEPT7 (red) in cells of the caudal fin epithelium (a), a neutrophil (mpx:GFP labeled) (b), and a macrophage (mpeg1:YFP labeled) (c). Scale bars, 10 μm. B. Survival curves of Ctrl or Sept15 morphants infected with T3SS- S. flexneri (ΔmxiD strain, low dose). Pooled data from 3 independent experiments per treatment using at least 15 larvae per experiment. Significance testing performed by Log Rank test. C. Enumeration of bacteria at 0, 24, or 48 hpi from Ctrl (open circles) or Sept15 (closed circles) morphants infected with T3SS- S. flexneri (ΔmxiD strain). Circles represent individual larvae, and only larvae having survived the infection (thus far) included here (i.e., dead larvae not homogenised for counts). Half-filled circles represent enumerations from larvae at time 0 and are representative of inoculums for both conditions. Pooled data from 3 independent experiments using up to 3 larvae per treatment. Mean ± SEM also shown (horizontal bars). Significance testing performed by Student’s t test. D. Representative western blot of extracts from larvae injected with Ctrl or Sept7b morpholino (Mo) using antibodies against GAPDH (as control) or SEPT7. E. Survival curves of Ctrl or Sept7b morphants infected in the HBV with S. flexneri M90T (low dose). Pooled data from 3 independent experiments per treatment using at least 15 larvae per treatment. Significance testing performed by Log Rank test. ***, P<0.001. F. Enumeration of bacteria at 0, 24, or 48 hpi from Ctrl (open circles) or Sept7b (closed circles) morphants infected with S. flexneri M90T (low dose). Half-filled circles represent enumerations from larvae at time 0 and are representative of inoculums for both conditions. Pooled data from 3 independent experiments using up to 3 larvae per treatment. Circles represent individual larvae, and only larvae having survived the infection (thus far) included here (i.e. dead larvae not homogenised for counts). Mean ± SEM also shown (horizontal bars). Significance testing performed by Student’s t test. *, P<0.05. G. Survival curves of Ctrl or Sept15 morphants infected in the caudal vein with S. flexneri M90T (low dose). Pooled data from 3 or more independent experiments per treatment using at least 15 larvae per experiment. Significance testing performed by Log Rank test. **, P<0.01. H. Enumeration of bacteria at 0, 24, or 48 hpi from Ctrl (open circles) or Sept15 (closed circles) morphants infected with S. flexneri M90T in the caudal vein. Circles represent individual larvae, and only larvae having survived the infection (thus far) included here (i.e., dead larvae not homogenised for counts). Half-filled circles represent enumerations from larvae at time 0 and are representative of inoculums for both conditions. Pooled data from 3 independent experiments using up to 3 larvae per treatment. Mean ± SEM also shown (horizontal bars). Significance testing performed by Student’s t test. **, P<0.01. PHENOTYPE:
|