
- Title
-
A classification system for zebrafish adipose tissues
- Authors
- Minchin, J.E., Rawls, J.F.
- Source
- Full text @ Dis. Model. Mech.

Adipose tissue growth dynamics in postembryonic zebrafish. (A-H′) Stereoscopic images of Nile Red-stained postembryonic zebrafish at stages indicated in Fig. 3B. The white boxes indicate the location of magnified images in the middle and right panels. The first AT to appear is PVAT (arrow in B′), followed by AVAT (upper arrow in C′; lower arrows beneath the dotted line indicate PVAT). CSAT is formed in the head (arrows indicate OCU or HYD ATs). (E′) LSAT (upper arrow) and RVAT (lower arrow) are detected on the zebrafish flank, and dotted line indicates the edge of the operculum. (F′) dOPC is deposited in dorsal cranial regions (arrow). (G′) DFRSAT is deposited at the dorsal fin (arrow). (H′) pCVAT is deposited on the ventral trunk in close proximity to the heart (white arrow; red arrow indicates lPECSAT). Dotted lines indicate the operculum boundary. (I) Total AT area relative to SL. (J) IAT area relative to SL. (K) SAT area relative to SL. (L) Body fat percentage relative to SL. Lines are fitted using locally weighted regression (LOESS) with 90% confidence regions shaded grey. |
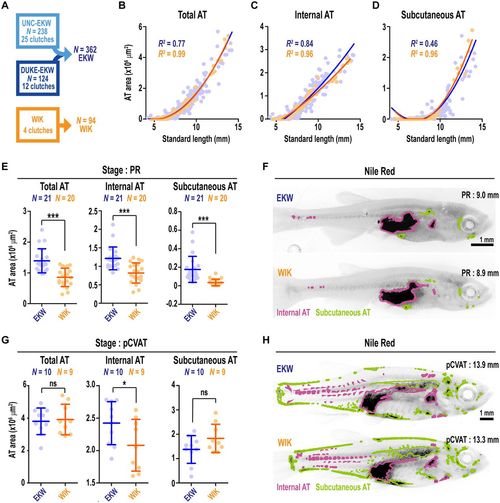
Comparison of adiposity dynamics between EKW and WIK wild-type zebrafish strains. (A) The 362 EKW zebrafish were compared with 94 WIK zebrafish derived from four independent clutches. (B-D) Scatterplots depicting total AT (B), internal AT (C) and subcutaneous AT (D) area relative to SL. Lines were fitted with polynomial regression. (E) Pairwise comparison of total AT, internal AT and subcutaneous AT between PR stage EKW and WIK zebrafish. (F) Representative images of Nile Red-stained PR stage zebrafish. Images are greyscale, inverted, and ATs are false coloured according to their classification. (G) Pairwise comparison of total AT, internal AT and subcutaneous AT between pCVAT stage EKW and WIK zebrafish. (H) Representative images of Nile Red-stained pCVAT stage zebrafish. Images are greyscale, inverted, and ATs are false coloured according to their classification. Groups were compared using Student's t-tests. *P<0.05; ***P<0.0001. |

Exposure to a high-fat diet preferentially increases internal AT in PB stage postembryonic zebrafish. (A) Schematic diagram illustrating the experimental design. Groups were raised normally until 27 dpf, and then fed either a standard feed (Std. feed) or high-fat 5% chicken egg yolk (CEY). (B) From 27 dpf, fish were housed in glass beakers, with 80% daily water changes. (C-D‴) Representative images of 41 dpf fish fed either the Std. feed (control, C-C‴) or a high-fat diet (5% CEY, D-D‴). Arrows in C and D indicate the position at the anal fin that was quantified in G, and the position of images magnified in C″ and D″. The outlines in C′ and D′ indicate IAT (PVAT+AVAT), which was quantified in F. (E) Scatterplot indicating the increased total AT area in high-fat-fed fish (red) relative to control-fed fish (black). Lines are fitted using ordinary least squares (OLS) regression, with 95% confidence intervals. (F) Quantification of total AT area in control (black) and high-fat-fed fish (red). (G) Quantification of interstitial fluorescence. RFU=relative fluorescence unit and was normalized to background. Groups in F and G were compared using Student's t-tests. **P<0.001; ***P<0.0001. n=15 control PB stage fish, and n=8 high-fat-fed PB stage fish. |
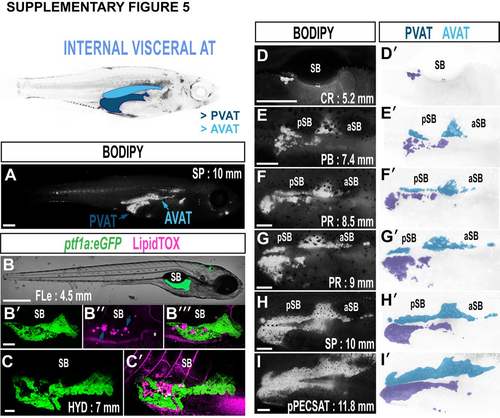
Growth characteristics of pancreatic (PVAT) and abdominal VAT (AVAT). A. BODIPY-stained zebrafish illustrating the location of PVAT and AVAT. B-C'. Maximum intensity projections of PVAT-LD localization to the exocrine pancreas. ptf1a:eGFP labels acinar cells of the exocrine pancreas (green), and LipidTOX labels neutral lipids (magenta). Spherical LipidTOX is contained within LDs (arrows), however neutral lipid in the circulation is also evident (asterisk marks the hepatic portal vein). D-I. Timeseries of BODIPY-labelled PVAT and AVAT reveals distinct morphological transitions during the growth. PVAT was the first AT to appear in 100% of fish in this study. D'-I'. False coloured images depicting PVAT (dark blue) and AVAT (light blue). Images are derived from D-I. Scale bars are; 500 µm (A), 500 µm (B), 100 µm (B'), 500 µm (C), 250 µm (D-I). SB = swim bladder, aSB = anterior swim bladder, pSB = posterior swim bladder. All fluorescent confocal and stereoscope images are of the right flank. |
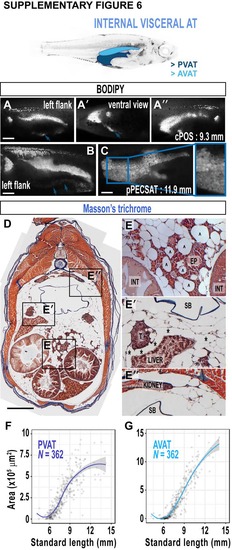
Growth characteristics of pancreatic (PVAT) and abdominal VAT (AVAT). A-A''. Representative images of PVAT flank asymmetry. The left flank (A) is almost devoid of PVAT in 9.3 mm fish, except for a small streak along the ventral midline (arrows, A & A'). The right flank exhibits standard PVAT morphology (A''). B. In larger animals a faint PVAT streak on the left flank is visible located between the looped intestinal tract (arrows). This image is the left flank of the same fish from Fig. S5I. C. PVAT and AVAT become pressed against each other; however, a line distinguishing these depots is visible. D. Paraffin-processed cross-section through an adult zebrafish trunk, stained with Masson's trichrome to label collagen (blue), nuclei (dark red/purple) and cytoplasm (red/pink). E. PVAT-LDs are studded within the exocrine pancreas (EP). E'. A gap separating AVAT and the liver is seen in sections (asterisks). This gap closes when AVAT meets PVAT (far right of image). Note the adipocytes studded in the testes (T). E''. The dorsalmost AVAT connects with the lateral extremes of the kidney. F. Relationship between SL and PVAT area. G. Relationship between SL and AVAT area. Scale bars are 500 µm. EP = exocrine pancreas, INT = intestinal tract, T = testes. All fluorescent confocal and stereoscope images are of the right flank unless otherwise stated. Fitted lines were generated by a LOESS function. |
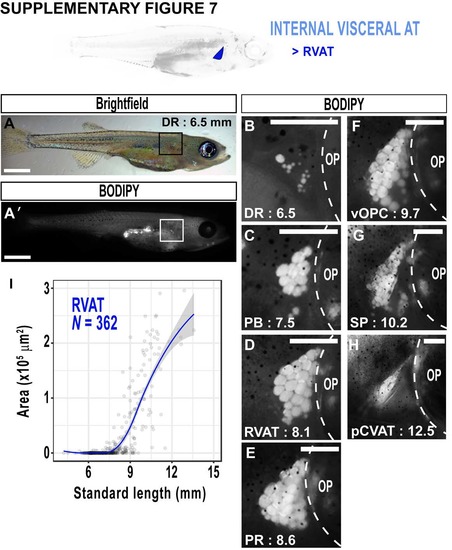
Growth characteristics of renal VAT (RVAT). A,A'. Brightfield image if zebrafish illustrating position of RVAT (box) (A), and corresponding BODIPY image (A'). B-H. Timeseries indicating the progression of RVAT growth. The images are from the region boxed in A. I. Relationship between SL and RVAT area. Scale bars are; 1 mm (A & A'), 250 µm (B-H). Dotted lines in B-H indicate the edge of the operculum. OP = operculum. Fitted lines were generated by a LOESS function. |
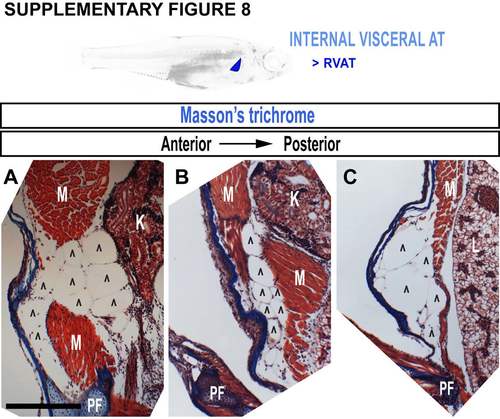
Growth characteristics of renal VAT (RVAT). A-C. Masson’s trichromestained cross-sections through an adult zebrafish trunk. Scale bars are 100 µm. K = kidney, L = liver, PF = pectoral fin, M = skeletal muscle. Carets indicate adipocytes. |

Morphology of cardiac VAT (CVAT) and pectoral fin SAT (PECSAT). AD. Timeseries indicating the progression of CVAT and PECSAT development. Fish are stained with BODIPY. Arrows indicate pPECSAT (red) and pCVAT (blue). A'-D'. Ventral views of the same fish in A-D. Arrows indicate pPECSAT (red) and pCVAT (blue), and arrowheads indicate aPECSAT (red) and aCVAT (blue). A''-D''. False coloured images of A'-D'. Red ATs are PECSAT, blue ATs are CVAT. E-J. Masson's trichrome-stained cross-sections through the adult zebrafish heart. Sections are at 3 distinct anteriorposterior levels. Note the accumulation of aCVAT in anterior locations (E, F), and its spread posterior (G-J). CVAT does not become fully enveloped by BWM (G & J). Asterisk indicates adipocyte-LDs. Scale bars are 100 µm (A-D) and 250 µm (E, G & I). OP = operculum, OES = oesophagus, AC = abdominal cavity, TC = thoracic cavity, PP = parietal pericardium, BWM = body wall musculature. |
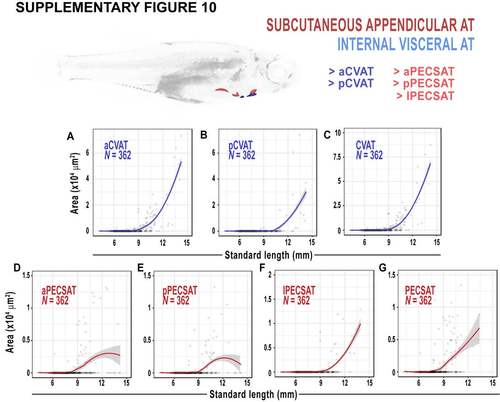
Morphology of cardiac VAT (CVAT) and pectoral fin SAT (PECSAT). AG. Relationship between SL, CVAT and PECSAT areas. Fitted lines were generated by a LOESS function. |
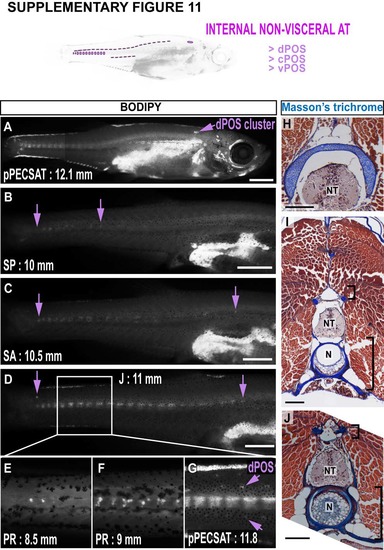
Development of paraosseal NVAT (POS) in zebrafish. A-D. A timeseries illustrating the development of POS. cPOS is most readily evident and it’s anteriorposterior extremes are indicated by arrows (B-D). Note the cluster of dPOS in the anterior trunk (A). E-G. Magnified images of the zebrafish tail region. Note the increasing intensity of cPOS in larger animals (central ‘stripe’), and the emergence of dPOS and vPOS on either side (arrows in G). H-J. Masson’s trichrome-stained cross-sections through adult zebrafish trunk regions. Note the dPOS cluster is located immediately dorsal the neural tube in an anterior region (H), and the continued location of dPOS close to the NT more posteriorly (small bracket, I & J). Also note the larger spread of cPOS in posterior locations (large bracket, I & J). Scale bars are 1 mm (A), 500 µm (B-D) and 250 µm (H-J). NT = neural tube. N = notochord. |
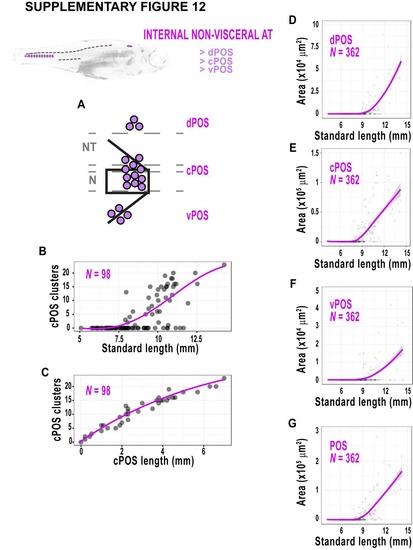
Development of paraosseal NVAT (POS) in zebrafish. A. Schematic illustrating the location of POS. B. The number of cPOS clusters in relation to to SL. C. The number of cPOS clusters relative to the anterior-posterior length of cPOS. D-G. Relationship between SL and POS ATs across the dataset. Fitted lines were generated by a LOESS function. |
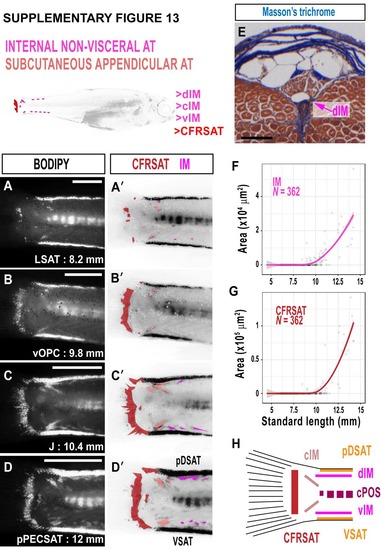
Intermuscular NVAT (IM) and caudal fin ray SAT (CFRSAT) in zebrafish. A-D. BODIPY timeseries illustrating the growth of IM and CFRSAT in the zebrafish tail. A'-D'. False coloured BODIPY images derived from A-D. CFRSAT is dark red, and IM deposits are magenta. E. Masson's trichrome-stained cross-section through the adult zebrafish tail showing dorsal IM (dIM). F. Relationship between IM and SL. G. Relationship between CFRSAT and SL. H. Schematic illustrating the multiple ATs within the zebrafish tail. Scale bars are 500 μm (A-D) and 100 μm (E). Fitted lines were generated by a LOESS function. |
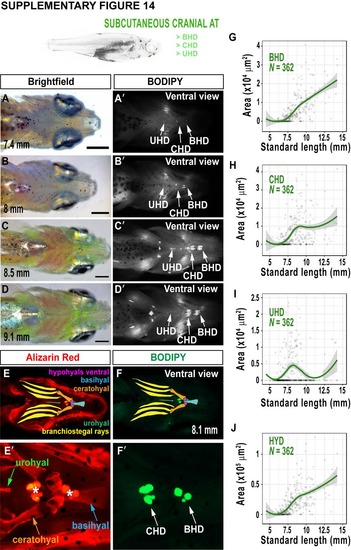
Deposition and growth of AT in proximity to the hyoid apparatus (HYD). A-D. Brightfield images depicting morphological changes of the zebrafish jaw. A'-D'. Fluorescence images of BODIPY stained neutral lipid corresponding to the same fish shown in A-D. Note the 3 distinct AT clusters associated with cartilaginous elements of the jaw. E-F'. Alizarin Red staining of mineralized bone within the jaw (E,E'). The outline of these elements are traced and highlighted by colour in E. Asterisk indicates LD clusters. BODIPY staining of the same animal reveals LD clusters in close proximity to the basihyal and ceratohyal bones (F,F'). G-J. Relationship between SL and HYD ATs across the dataset. All views are from ventral. Scale bars are 1 mm (A-D). BHD = basihyoid AT, CHD = ceratohyoid AT, UHD = urohyoid AT. Fitted lines were generated by a LOESS function. |

Ocular (OCU) and opercular (OPC) AT development. A-F. BODIPY stained zebrafish to illustrate the LD accumulation on the lateral zebrafish head. A’-F’. False coloured images based on A-F, to identify OPC (dark green) and OCU (light green) clusters. Scale bars are 1 mm (A-F). E = eye. |
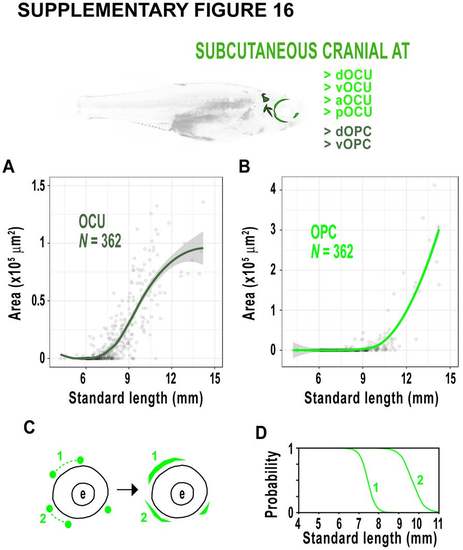
Ocular (OCU) and opercular (OPC) AT development.A. The relationship between SL and OCU. B. The relationship between SL and OCU. C,D. Schematic of the OCU depots. dOPC (1) is initially 2 clusters that connect to form an elongated AT across the dorsal eye. Posterior OPC (pOPC) and ventral OPC (vOPC) sometimes connect (2) at a later stage indicated by logistic regression (D). Fitted lines were generated by a LOESS function in A & B. |
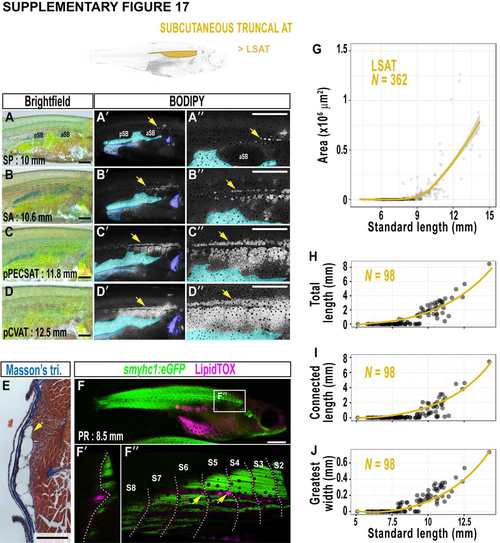
Lateral SAT (LSAT) expands to cover the zebrafish flank. A-D. Brightfield images of the zebrafish flank. A'-D'. Corresponding fluorescence stereoscope images of BODIPY stained zebrafish. LSAT is indicated by arrows. Blue regions correspond to AVAT (cyan), PVAT (light blue) and RVAT (dark blue). Fish are the same as A-D. A''-D''. Magnified images of BODIPY staining on the zebrafish flank. LSAT is indicated by arrows and AVAT is false coloured cyan. E. Masson's trichrome-stained cross-section of LSAT (arrow) in a subcutaneous position. F-F''. Fluorescent stereoscope image (F) of smyhc1:eGFP transgenic fish labelling slow muscle (green) counterstained with LipidTOX (magenta) to label neutral lipid. A single Z-stack slice in the Z axis (F') confirms LDs (magenta) are superficial to the slow muscle (green). Maximum intensity projection to reveal small LSAT-LDs at the horizontal myoseptum (arrows). S2-8 indicate somites 2- 8. G. The relationship between LSAT and SL. H. Total length of LSAT relative to SL. I. Length of longest connected stretch of LSAT relative to SL. J. Greatest width of LSAT relative to SL. Scale bars are 500 μm (A-D and A''-D''), 250 μm (E) and 1 mm (F). pSB = posterior swim bladder, aSB = anterior swim bladder. Fitted lines were generated by a LOESS function. |
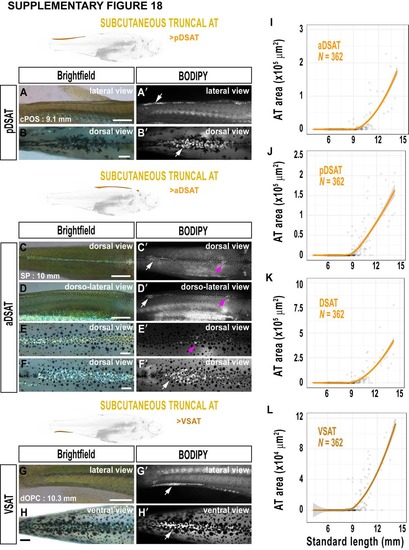
Dorsal (DSAT and ventral (VSAT) stretches of subcutaneous truncal AT in zebrafish. A-B'. Brightfield (A & B) and BODIPY labelled (A' & B') images of posterior DSAT (pDSAT; posterior to the dorsal fin), from lateral (A & A') and dorsal (B & B') views. Arrows indicate pDSAT. C-F'. Brightfield (C-F) and BODIPY+ (C'-F') of anterior DSAT (aDSAT; anterior to the dorsal fin). Arrows indicate the anterior (magenta) and posterior (white) clusters of aDSAT. G-H'. Brightfield (G & H) and BODIPY stained images (G'-H') illustrating location of VSAT (arrows). I-L. Boxplots showing the relationship between DSAT, VSAT and SL. Scale bars are 500 μm (A, A', C-D', G & G'), and 250 μm (B, B', EF' and H-H'). Fitted lines were generated by a LOESS function. |
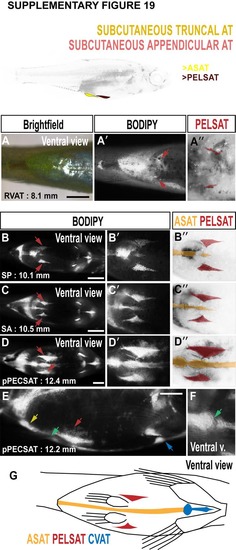
Morphology of abdominal SAT (ASAT) and SAT associated with the pelvic fin (PELSAT). A-A''. Brightfield (A), BODIPY (A') and false coloured BODIPY (A'') images to illustrate the earliest stages of PELSAT formation (arrows in A', and red in A''). B-D. BODIPY timeseries to illustrate the progressive growth of PELSAT (arrows) and ASAT. B'-D'. Magnified images to illustrate the wedge-shaped PELSAT and single streak of ASAT running along the ventral midline. B''-D''. False coloured BODIPY images based on B'-D' to show PELSAT (red) and ASAT (yellow). E. Lateral view to illustrate the morphology of PELSAT (red arrow) and ASAT (yellow arrow). The blue arrow indicates CVAT. F. At the location of the pelvic girdle, a discontinuous join is present in ASAT. G. Schematic illustrating the morphological characteristics of ASAT, PELSAT and CVAT. Scale bars are 1 mm (A-D), 500 μm (E). |
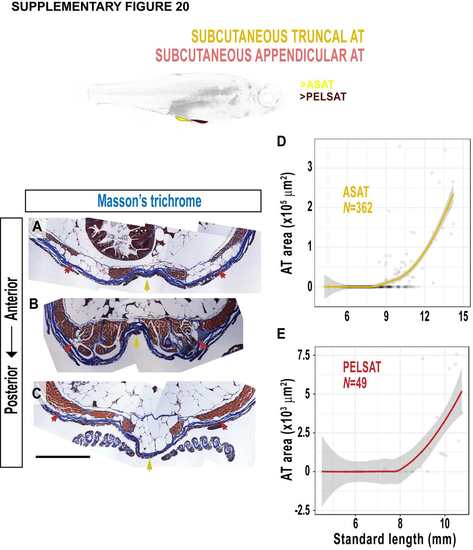
Morphology of abdominal SAT (ASAT) and SAT associated with the pelvic fin (PELSAT). A-C. Masson’s trichrome-stained cross-sections to view ASAT (yellow arrows) and PELSAT (red arrows) at distinct anterior-posterior levels. D, E. Relationship of the area of ASAT (D) and PELSAT (E) relative to SL. Scale bars is 500 μm. Fitted lines were generated by a LOESS function. |
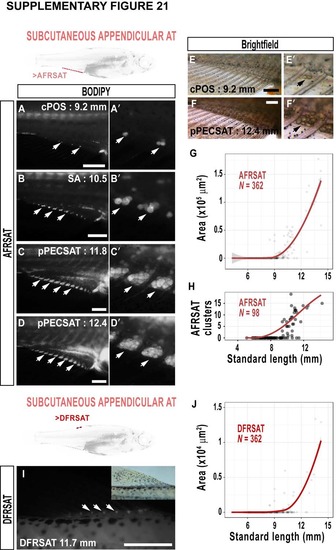
The development of ATs at the anal (AFRSAT) and dorsal (DFRSAT) fin rays. A-D'. BODIPY timeseries of AFRSAT development. A'-D' are magnified images of A-D. Arrows indicate AFRSAT clusters. E-F'. Brightfield images of AFRSAT (arrows). G. Relationship between AFRSAT area and SL. H. Number of AFRSAT clusters. I. Brightfield (inset) and BODIPY images of DFRSAT (arrows). J. DFRSAT relative to SL. Scale bars are 500 μm. Fitted lines were generated by a LOESS function. |
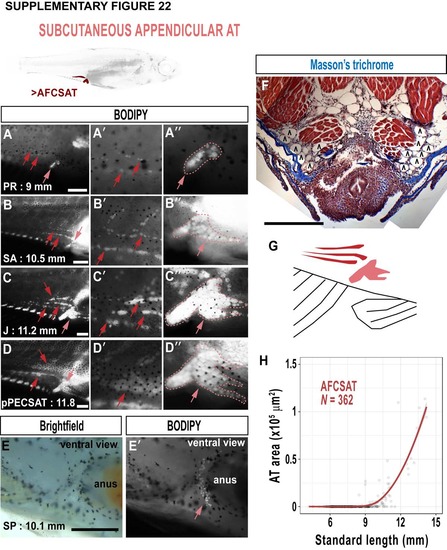
The complex and distinctive morphology of anal fin cluster SAT (AFCSAT). A-D. BODIPY timeseries illustrating the 2 distinct clusters of AFCSAT; the anterior cluster (light red arrow) and the horizontal stripes (dark red arrows). A'-D'. Magnified images illustrating the horizontal stripes AFCSAT (arrows). A''-D''. Magnified images of the anterior AFCSAT cluster (arrows). E, E'. Brightfield (E) and BODIPY showing the anterior AFCSAT cluster from ventral (arrow). F. Masson's trichrome-stained cross-section showing the bilateral horizontal AFCSAT stripes. G. Schematic illustrating the distinct morphologies of the 2 distinct AFCSAT clusters: the horizontal stripes (dark red) and the anterior cluster (light red). H. Relationship between AFCSAT area and SL. Scale bars are 100 μm (A-E) and 500 μm (F). Fitted lines were generated by a LOESS function. |
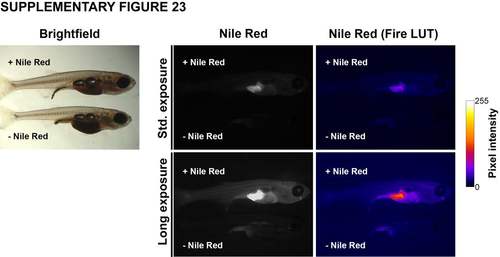
Levels of autofluorescence do not interfere with measurement of AT area in FLD stained zebrafish. Brightfield (left panel) image of two postembryonc zebrafish. Fluorescence image of a Nile Red stained postembryonic fish (upper fish) and a ‘no-dye’ control not stained with Nile Red (lower fish). Background levels in the ‘no-dye’ control are minimal, and do not interfere with measuring AT area. |