
- Title
-
Imaging early embryonic calcium activity with GCaMP6s transgenic zebrafish
- Authors
- Chen, J., Xia, L., Bruchas, M.R., Solnica-Krezel, L.
- Source
- Full text @ Dev. Biol.

GCaMP6s expression and fluorescencein Tg[βactin2:GCaMP6s]stl351/stl351 and Tg[ubi:GCaMP6s]stl352/stl352 transgenic zebrafish during early embryogenesis. (A) Schematics of the Tol2[βactin2:GCaMP6s] or Tol2[ubi:GCaMP6s] constructs. (B) GCaMP6s fluorescent confocal microscope images in Tg[βactin2:GCaMP6s]stl351/stl351 and Tg[ubi:GCaMP6s]stl352/stl352 embryos at several developmental stages. a, a’, d, d’, lateral view; b, b’, c, c’, animal pole view. Asterisks indicate the yolk, and arrowheads point to the blastodisc in a, a’. Arrows point to the heart in d, d’. (C-D)RT-PCR and qRT-PCR analyses of GCaMP6s RNA expression levels in Tg[βactin2:GCaMP6s]stl351/stl351 and Tg[ubi:GCaMP6s]stl352/stl352 embryos in the course of embryogenesis. The qRT-PCR results were normalized to β-actin. Error bars represent standard deviation; N=3. |
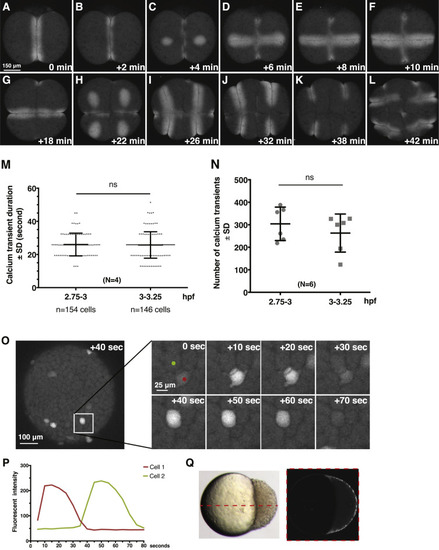
Dynamics of Ca2+ signaling in Tg[βactin2:GCaMP6s]stl351/stl351 embryos at cleavage and blastula stages. (A-L) Still images of GCaMP6s signals during cleavage furrow progression from 2-cell stage to 16-cell stage. (M) Quantification of Ca2+ transient duration before and after MBT. Error bars represent standard deviation; N=4 embryos. ns, not significant. (N) Comparison of Ca2+ transient numbers before and after MBT; N=6 embryos. (O-P) Still images and traces of Ca2+ transients in a time-lapse series at blastula stages. (Q) Time-lapse overlay of GCaMP6s signal from 3.7 hpf to 4 hpf from a single z-section in lateral view. |
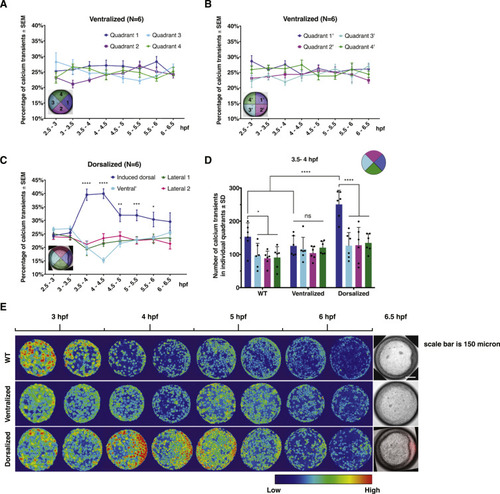
EVL Ca2+ signaling pattern in ventralized and dorsalized embryos. (A-B) Automated quantification of EVL Ca2+ transient frequency in ichabod/β-catenin2 ventralized embryos between 2.5 hpf and 6.5 hpf. Error bars represent S.E.M.; N=6 embryos. (C) Automated quantification of EVL Ca2+ transient frequency in β-catenin1-injected dorsalized embryos. Induced dorsal organizer is oriented to the right. Error bars represent S.E.M. *, P≤0.05. **, P≤0.01***, P≤0.001. ****, P≤0.0001; N=6 embryos. (D) Comparison of Ca2+ transient number in individual quadrants among WT, ventralized, and dorsalized embryos at 3.5–4 hpf. Error bars represent standard deviation. ns, not significant. *, P≤0.05. ****, P≤0.0001; (E) Representative 30-min time-lapse overlay of GCaMP6s signals in WT, ventralized, and dorsalized embryos from 2.5 hpf to 6.5 hpf. |
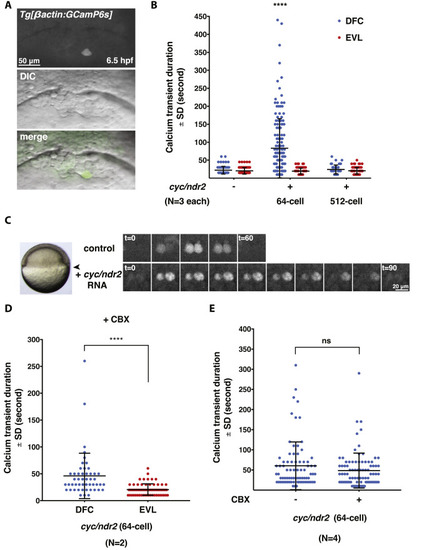
Excess Nodal signaling prolongs Ca2+ transient duration specifically in the DFCs. (A) Representative images of a single Ca2+ transient in a DFC at 6.5 hpf. (B) Quantification of Ca2+ transient duration in WT and Cyc/Ndr2-misexpressing embryos. Error bars represent standard deviation. ****, P≤0.0001. N=3 embryos in control and Cyc/Ndr2-misexpressing embryos, respectively. (C) Still images of Ca2+ transients in the DFCs of uninjected control and Cyc/Ndr2-misexpressing embryo in a time-lapse series. Arrowhead points to the DFC region that was imaged. (D) Quantification of DFC Ca2+ transient duration between DFCs and EVL cells in cyc/ndr2 RNA-injected embryos after CBX treatment. ****, P≤0.0001. N=2 embryos. (E) Quantification of DFC Ca2+ transient duration in Cyc/Ndr2-misexpressing embryos before and after CBX treatment. ns, not significant; N=4 embryos. |
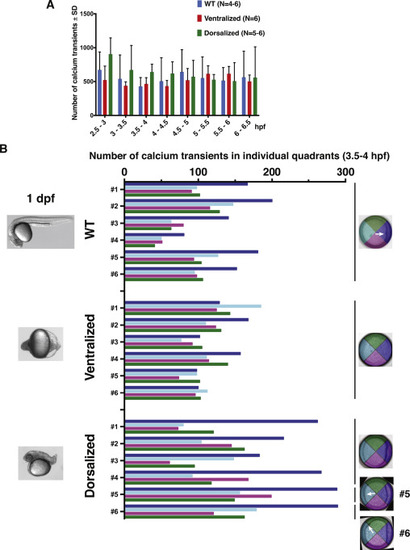
Fig. S3. Comparison of calcium transient numbers in WT and mutants. (A) Quantification of total number of EVL calcium transients in WT, ventralized, and dorsalized embryos from 2.5 hpf to 6.5 hpf. N indicates the number of embryos in each group.(B) Quantification of EVL calcium transient numbers in each quadrant at 3.5–4 hpf from individual embryos. Arrows indicate the endogenousdorsal organizer. |
Reprinted from Developmental Biology, 430(2), Chen, J., Xia, L., Bruchas, M.R., Solnica-Krezel, L., Imaging early embryonic calcium activity with GCaMP6s transgenic zebrafish, 385-396, Copyright (2017) with permission from Elsevier. Full text @ Dev. Biol.