
- Title
-
Distinct roles of neuroepithelial-like and radial glia-like progenitor cells in cerebellar regeneration
- Authors
- Kaslin, J., Kroehne, V., Ganz, J., Hans, S., Brand, M.
- Source
- Full text @ Development
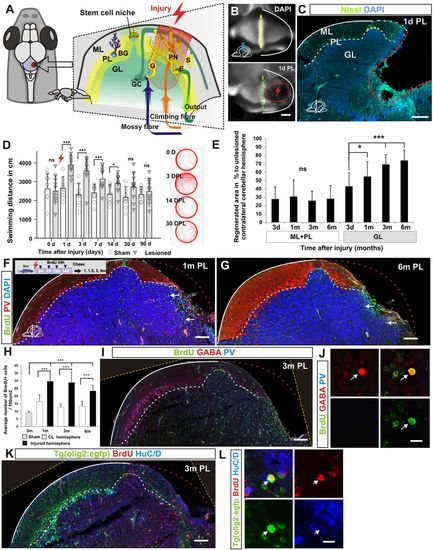
Morphological and behavioural recovery after cerebellar injury. (A) Overview of cerebellar architecture in zebrafish and the injury model. The cerebellum contains only a few cell types of distinct morphology. The cerebellum has a simple laminar architecture consisting of a molecular layer (ML), Purkinje cell layer (PL) and granule cell layer (GL). The unilateral injury removes cells from all three layers. Importantly, the lesion spares the stem cell niche. The GL consists of densely packed excitatory granule cells (GC) and inhibitory Golgi neurons (G). The PL contains Purkinje neurons (PN), specialised Bergmann glia (BG), and excitatory eurydendroid cells (E). The ML consists of nerve fibres and scattered inhibitory stellate cells (S). Neural stem cells are maintained in the dorsomedial part of the cerebellum around a remnant of the IVth ventricle. (B) A piece of the corpus cerebelli, including all cell layers, is unilaterally removed (red lightning). A confocal maximum projection showing a dorsal view of an unlesioned (top) and a lesioned (bottom) cerebellum 1 day after the injury. The stem cell niche is indicated with a yellow dashed line. The extent of the lesion is indicated with a red dashed line. (C) A transverse section of the corpus cerebelli showing the lesion 1 day after injury. (D) Automatic tracking of swimming distance and pattern during 5 minutes. Cerebellar injury induced significantly increased swimming activity from 1 to 14 days after injury. n=11 for sham and injured groups; 1, 3, 7 days post-lesion (DPL) ***P<0.001, 14 DPL *P<0.05; error bars indicate s.d. (E) Morphological quantification of the lesioned area after injury. Lesioned area compared with lesion size measured 3 days after injury. n≥5 per time point; 1 month *P<0.05, 3 and 6 months ***P<0.001; ns, not significant; error bars indicate s.d. (F,G) Transverse section of the corpus cerebelli showing that BrdU-stained cells (green) are recruited and maintained (arrows) in the GL of the lesioned hemisphere 1 and 6 months after injury. Few BrdU-stained cells are detected in the ML and PL. Purkinje cells are stained with parvalbumin (PV; red). (H) Quantification of BrdU-positive cells in the GL in the injured and contralateral hemisphere 1 , 3 and 6 months after injury. n=5 per time point; ***P<0.001; error bars indicate s.d. Sham control animal is included as reference point for normal granule cell production rate (3 months after BrdU pulse). CL, contralateral uninjured hemisphere. (I,J) Cerebellar transverse section showing BrdU, GABA and PV staining 3 months after injury. Very few BrdU/GABA-positive cells are detected (arrow). (K,L) Cerebellar transverse section showing olig2:gfp, BrdU and HuC/D staining 3 months after injury. BrdU/olig2:gfp-positive cells are very rarely detected (arrow). Yellow dashed line indicates original picture border in rotated images. Scale bars: 200 μm (B); 150 μm (C); 100 μm (F,G,I,K); 10 μm (J,L). |
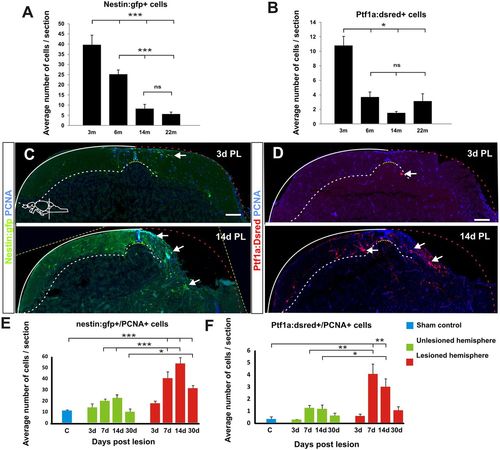
Stem and progenitor cell response to cerebellar injury. (A,B) Quantification of nestin:gfp and ptf1a:DsRed cells in the aging cerebellum during homeostasis. nestin:gfp: n=5 at 3, 6 and 22 months, n=6 at 14 months, ***P<0.001; ptf1a:DsRed: n=7 at 3, 6 months, n=6 at 14 months, n=5 at 22 months, *P<0.05; error bars indicate s.e.m. (C,D) Maximum projections of cerebellar transverse sections showing stem cell activation after injury. Initially, the tissue morphology is severely altered at the level of the injury and therefore sections from the very rostral end of the lesion were chosen to show the stem cell response. Three days after the lesion, both ptf1a:DsRed+ (red) and nestin:gfp+ (green) stem cell activity (arrows) is unaltered. Stem cell activity (arrows) is significantly increased 7 days after injury and peaks ∼2 weeks after injury. Proliferating cells are labelled with Pcna (blue). (E,F) Quantification of cerebellar stem cell activity after injury. A significant increase in the number of nestin:gfp+ cells is seen from 7 to 30 days after the lesion. Sham control n=5, 3 DPL n=4, 7 DPL n=6, 14 DPL n=5, 30 DPL n=5; *P<0.05, ***P<0.001; error bars indicate s.e.m. A significant increase in ptf1a:DsRed+ stem cells is detected 7 and 14 days after injury. Sham control n=7, 3 DPL n=4, 7 DPL n=5, 14 DPL n=5, 30 DPL n=5; *P<0.05, **P<0.01; error bars indicate s.e.m. Note the differences in scale on the y-axis between E and F (60 versus 6 cells). Yellow dashed line shows original picture border in rotated images. Scale bars: 100 μm. |
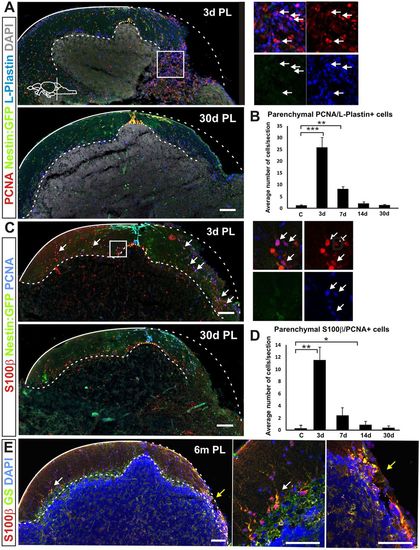
Inflammation and scarring after injury. (A) Cerebellar transverse section showing proliferating (Pcna+) nestin:gfp− parenchymal cells (green) colocalising with the leukocyte marker L-plastin (arrows) 3 days after injury. Parenchymal proliferation and leukocyte numbers were restored towards homeostatic levels 30 days after injury. (B) Quantification of proliferating Pcna/L-plastin-positive cells in the cerebellar parenchyma after injury. A significant increase in the number of proliferating L-plastin+ cells is detected during the first week. The number of proliferating L-plastin+ cells is back to control levels 14 days after injury. **P<0.01, ***P<0.001; n=5 for each time point. (C) Proliferating Bergmann glia (Pcna/S100β+) are also detected in the parenchyma after injury (arrows). (D) Quantification of proliferating Bergmann glia shows a significant number in the cerebellar parenchyma 3 days after injury. *P<0.05, **P<0.01; n=55 for each time point. The number of proliferating Bergmann glia decreases the first week after injury and is back to homeostatic levels 30 days after injury. (E) Glial proliferation does not result in glial scarring. No notable accumulation of the glial markers S100β (red) and GS (green) can be detected at the injury site 6 months after injury (n=5). The arrowed regions are magnified to the right, illustrating proliferating leukocytes in A and proliferating Bergmann glia in C (white arrows) and Bergmann glia at the lesion site (yellow arrows). Scale bars: 100 μm. |
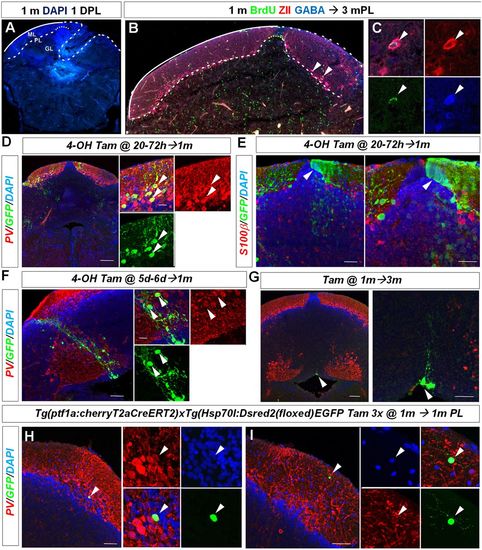
Juvenile zebrafish regenerate diverse cerebellar cell types. (A) Representative cerebellar transverse section in a juvenile 1-month-old zebrafish showing the lesion area 1 day after injury. (B,C) BrdU/ZII/GABA+ Purkinje neurons are found at the lesion site 3 months after injury (arrowheads). (D) Cerebellar transverse section showing recombined GFP/PV+ Purkinje cells (arrowheads) in Tg(ptf1a:cherryT2aCreERT2)1; Tg(hsp70l:DsRed2(floxed)EGFP) fish 1 month after recombination. (E) Cerebellar transverse section showing unilateral GFP labelling of neuroepithelial-like stem cells (arrowhead) and granule cells. (F) GFP-labelled radial glia-like cells and a clone of PV− interneurons (arrowheads) recombined between 5 and 6 days postfertilisation. (G) Quiescent GFP-labelled radial glia-like cells (arrowhead) recombined at 1 month and analysed 3 months later. (H) Recombined GFP/PV+ Purkinje cell (arrowhead) 1 month after tamoxifen treatment and injury of a juvenile zebrafish. (I) A recombined GFP+ and PV− stellate cell (arrowhead) 1 month after tamoxifen treatment and injury. Scale bars: 75 μm (D); 35 μm (E); 50 μm (F); 100 μm (G); 50 μm (H,I). |
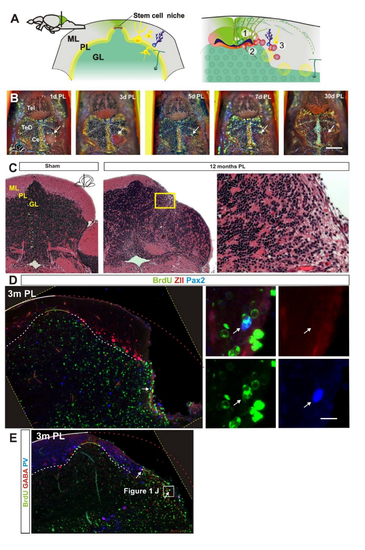
A. Overview of the adult stem cell niche in the cerebellum. Stem cells are located around a small out pocketing of the fourth ventricle. 1. Polarized neuroepithelial-like stem cells (green) are restricted to the midline of the dorsal cerebellum. The stem cells give rise to rapidly migrating granule precursors (dark green) that initially migrate dorsolaterally and give rise to granule neurons in a distinct outside-in fashion. 2. Radial glia-like stem and progenitor cells are located ventral to the neuroepithelial-like stem cells and largely quiescent in the adult. 3. Bergmann glia and inhibitory inter-neurons are produced at a low level at the lateral margin of the ventricle. In addition, rare stem cells reside in the cerebellar parenchyma. GL=granule cell layer, ML=molecular cell layer, PL=Purkinje cell layer. B. Representative timelapse of a lesioned fish showing rapid wound healing after injury. Dorsal view of the lesion site (hatched white line and white arrow). The injury is fully covered three days after injury and at five days after injury pigment cells are readily detected at the injury site. Ce=Cerebellum, PL=post lesion, Tel=Telencephalon, TeO=Optic tectum. C. Hematoxylin and Eosin stained cerebellar cross section from sham injured and injured fish twelve month after injury (n=5/condition). The Purkinje and molecular cell layer has recovered very poorly. No notable fibrotic or glial scarring is detected. GL=granule cell layer, ML=molecular cell layer, PL=Purkinje cell layer. D. Cerebellar cross section showing BrdU (green), ZebrinII (Red) and Pax2 (Blue) staining three months after injury. No BrdU/ZII positive cells are detected and very few BrdU/Pax2 positive cells are detected (arrow). E. Cerebellar cross section showing BrdU (green), GABA (Red) and Parvalbumin (Blue) staining three months after injury. No BrdU/PV positive cells are detected and very few BrdU/GABA positive cells are detected (arrows). Yellow hatched line show original picture border in rotated in images. |
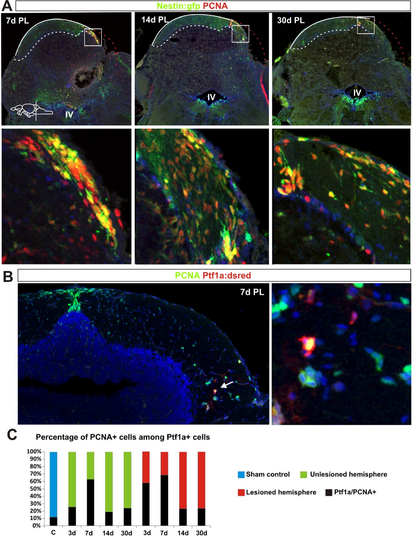
A.Confocal maximum projections of cerebellar cross sections showing stem cell activation after injury. nestin:gfp+ (green) neuroepihelial-like stem cells and proliferating cells labelled with PCNA (red). B. Confocal maximum projections of cerebellar cross sections showing a proliferating (green) ptf1a:Dsred+ (red) VZ progenitor in the parenchyma. Proliferating cells labelled with PCNA (green), DAPI (blue). C. Quantification of proliferating cells among the pool of Dsred+ cells. Dsred is very stable (many days) in the cells and persist in differentiating cells. The proportion of PCNA+ cells is reduced notably 14 days after injury suggesting that majority of Dsred+ cells are differentiating. (Sham control n=7, 3DPL n=4, 7DPL n=5, 14DPL n=5, 30 DPL n=5). |
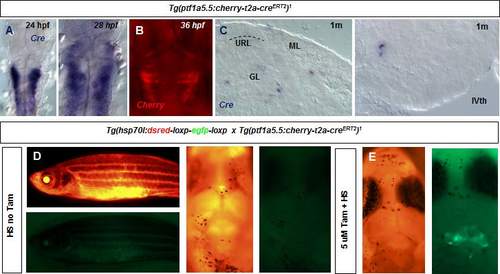
A. In situ hybridization and analysis of the expression of the Cre transgene in the Tg(ptf1a:cherryT2aCreERT2)1 fish line. Cre is expressed in the ventricular zone of the embryonic hindbrain and cerebellar primordium. B. Expression of cherry in the embryonic hindbrain and cerebellum in the Tg(ptf1a:cherryT2aCreERT2)1 fish. C. Expression of Cre in cross section of the cerebellum of a one month old zebrafish. D. Heatshocking of Tg(ptf1a:cherryT2aCreERT2)1; Tg(hsp70l:DsRed2(floxed)EGFP) juvenile zebrafish fish does not result in unconditional recombination (n=12). E. Heatshocked tamoxifen treated juvenile fish shows recombined cells (green) in the cerebellum. |
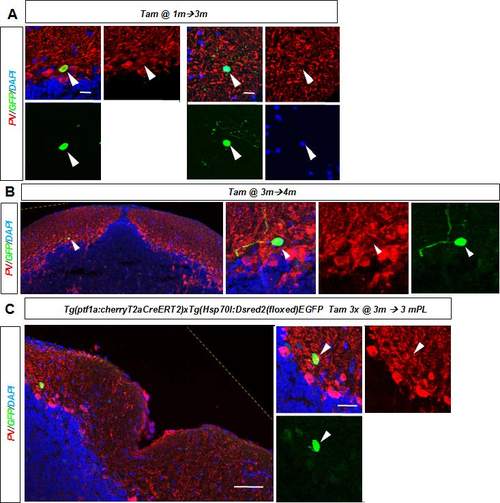
A. Recombined GFP/PV+ Purkinje cell (left) and PV- negative inter-neuron (right) with stellate morphology in the cerebellum 3 months after recombination of a one month old juvenile fish. B. A recombined GFP/PV- inter-neuron in the adult cerebellum one month after tamoxifen treatment. C. A recombined GFP+ and PV- interneuron in the cerebellum three months after injury and tamoxifen treatment of an adult zebrafish. Yellow hatched line show original picture border in rotated in images. |