- Title
-
Medaka vasa is required for migration but not survival of primordial germ cells
- Authors
- Li, M., Hong, N., Xu, H., Yi, M., Li, C., Gui, J., Hong, Y.
- Source
- Full text @ Mech. Dev.
|
vasa is required for PGC migration. MOvas was zygotically injected at 1.5 ng per NgVg transgenic embryo. Embryogenesis was regularly monitored and PGCs (green) were visualized by fluorescent microscopy. Three phenotype classes are shown at critical stages at 19, 22 and 34. (A–C′) Control morpholino MOvc-injected embryos showing normal development. A similar number of PGCs is seen in control and vasa-depleted embryos. An ectopic PGC is indicated by an arrow in (C). (D–F′) Class I morphant. Gastrulation and somatic development are normal as evidenced by major organ systems including somites (so), eye, ear and pigment cells (pc) that are black in the eye and yellow autofluorescent in the trunk. Specifically, defects in PGCs are clearly seen. By stage 22 when PGCs are normally in two bilaterally aligned clusters dorsal to the somites (B and B′) PGCs in all of MOvas-depleted embryos also form two bilateral clusters but exhibit slightly wider distribution relative to the embryonic axis (broken line) (E and E′). Subsequently, when PGCs are normally seen in the gonad (gd), many PGCs distributes to ectopic sites outside the gonad (F and F′). (G–I′) Class II morphant. Gastrulation with slight defects leads to a smaller axis with visible somites (H). Bilateral distribution is maintained at stage 22 but further widened (H′). At stage 34, the majority of PGCs reside in ectopic sites (I and I′). This class forms major organs and often exhibits the accumulation of blood cells (bc, red). (J–L′) Class III morphant. Gastrulation is arrested at 50% epiboly (J). PGCs are seen in disorganized cell mass that do not form the axis and organs. Red fluorescent micrographs show relative doses by a co-injected tracing dye (A, D, G and J). (M–P) Dorsal views of a MOvas-injected whole embryo at stage 34 showing somatic development and PGC distribution. (M and N) Focus on the head. (O and P) Focus on the trunk and PGCs. Bright field micrographs show gross morphology (B–C, E–F, H–I, K, M and O). Fluorescent optics shows GFP-positive PGCs (B′–L′, N and P). (Q) Phenotype classes. Coinjection of vasa RNA increases class I and decreases class II and III embryos. (R–T) PGC development. (R) PGC number at stage 22. MOvas with increasing doses slightly decreases the PGC number. The differences are not statistically significant. (S) Number of embryos with at least four ectopic PGCs. (T) Number of ectopic PGCs per embryos. Co-injected vasa RNA counteracts the effect of MOvas on PGCs. Numericals in or above columns indicate total numbers of embryos (Q–S) and PGCs (T) examined. Data are in means ± SD (error bars). ∗p < 0.05; ∗∗p < 0.01. |
|
Phenotypic rescue and PGC identity. (A–E) PGCs in embryos injected with MOvas into one of the 2-cells. The insert of (A) shows the MOvas distribution in half of the embryo (asterisk). At stage 19, all PGCs at both sides are aligned normally (B) or nearly so (C). At stage 34, many ectopic PGCs (arrows) are seen in the injected side (D and E). (F–J) vasa RNA can rescue abnormal PGC distribution caused by MOvas. Somatic development appears normal. Many PGCs are seen in the gonad, and ectopic PGCs are usually found close to the gonad, compared to wide distribution of PGCs distantly from the gonad in embryos injected with MOvas only (see Fig. 1F′). (K–N) PGC identity. (K and L) Embryos by stage 22. The germ cell marker dazl RNA is normally expressed in normal and ectopic PGCs (arrows) of MOvc-injected control (K) and MOvas-injected embryos (L). (M and N) Embryos by stage 34. Similar stability and localized perinuclear speckles of the Nanos:GFP fusion protein (green) from injected nos:fgp RNA are seen in both MOvc- and MOvas-injected embryos. Notably, the GFP intensity and nuclear speckle formation are normal also in ectopic PGCs of MOvas-injected embryos (asterisks in N). |
|
Specificity of vasa morpholinos. (A–C), Coinjection of MOp53 does not prevent the PGC migration defect caused by vasa morpholino. Morpholinos were zygotically injected at 1.5 ng and PGC distribution was analyzed from 2 dpf onwards. (A) Injection of MOvc alone. (B) injection of MOvas together with MOp53 against the medaka p53 mRNA. (C) Coinjection of MOvas and MOp53. MOp53 does not prevent MOvas-induced ectopic PGCs. (D–G) MOvas2 prevent its translation. (D) MOvas2 reduces the GFP signal of PGCs in Vg embryos. (E) MOvas2 does not reduce the GFP intensity in Ng embryo. (F and G) Positions and the target sequences of MOvas and MOvas2 on the vasa cDNA. ATG, initiation codon; open box, untranslated region; filled box, coding sequence. MOvas acts on the endogenous vasa RNA only, whereas MOvas2 can target both the vasa RNA and transgene-derived Vg RNA, thus reduces the GFP signal in PGCs. Asterisks depict normally distributed PGCs, arrows indicate ectopic PGCs. |
|
Behavior of vasa-depleted PGCs at ectopic sites. A representative MOvas-injected class II embryo is shown in dorsal lateral views. (A and B) Phenotype and PGC distribution at day 3. (C) Day 5. (D) Day 7. Many PGCs are seen outside the gonad (gd). These ectopic PGCs do not disappear, and undergo cell divisions. Some of these ectopic PGCs are numbered for continuous observation. For example, PGC1 and PGC2 from day 3 (B) to day 5 (C) produce two (2a and 2b) and 4 daughter PGCs (1a–1d). Furthermore, PGCs 1a–1c are seen at cytoplasm division each, as clearly shown in the insert for PGCs 1a and 1c. These ectopic PGCs steadily change their positions, as most evident for numbered PGCs. Cell movement persists until 7 dpf (D), when PGCs 1c and 1d moved down beyond focus and invisible in this particular view. Pigment cells (pc, yellow), blood cells (bc, red) and blood vessel (bv, red color due to blood cells) on the yolk sac are visible. The embryo enlarged by continuous growth. Anterior is to the left. |
|
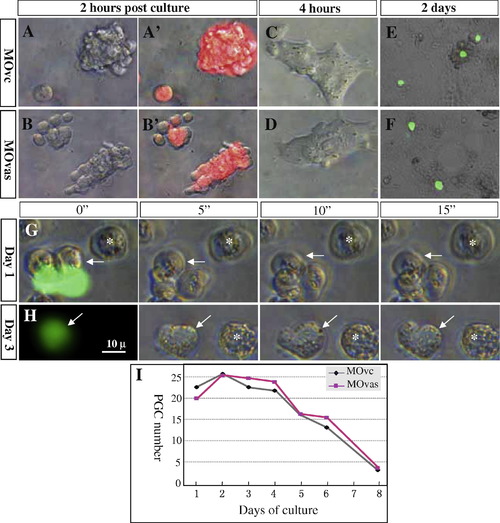
Behavior of vasa-depleted PGCs in vitro. MOvc and MOvas were zygotically injected at 1.5 ng/embryo and the resulting early NgVg gastrula embryos were dissociated for culture. (A–F) MOvas injection does not affect cell growth. Red fluorescence comes from a co-injected tracing dye. (E and F) MOvas injection does not affect PGC (green) formation. (G) Proliferation and motility of PGCs (arrow) at 1 dpc. At this stage both PGCs and somatic cells (asterisk) steadily change their shape, form filopodia and undergo ameba-like movements. The displacement of two PGCs on the merged image (left) reflects quick changes in cell shape during photography. (H) Serial micrographs showing the motility of PGCs at 3 dpf. (I) Time course of PGC numbers. Shown are six representatives of MOvc- and MOvas-injected embryos each. |
|
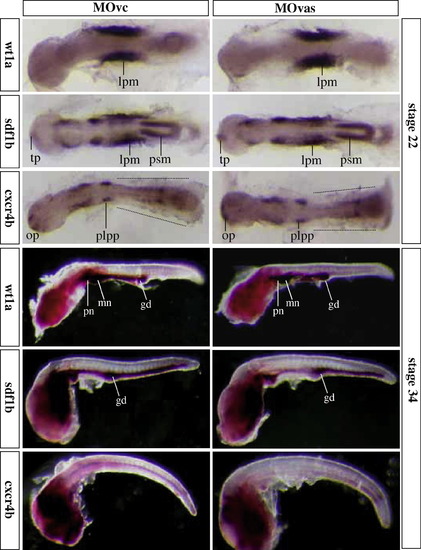
Analyses of RNA expression profiles of wt1a, sdf1b and cxcr4b by whole mount in situ hybridization. Normal expression of wt1a, sdf1b and cxcr4b is seen in MOvas-injected embryos compared to MOvc-injected control embryos. By stage 22, wt1a is expressed in lateral plate mesoderm (lpm), sdf1b is high in the lpm and presomitic mesoderm (psm) and weak in the telencaphalon (tp), whereas cxcr4b is abundant in posterior lateral line placodes (pllp), olfactory placodes (op) and weak in the lateral somatic area where PGCs normally reside (dot line). By stage 34, similar expression patterns of the three genes are also seen in MOvas- and MOvc-injected embryos. gd, gonad; mn and pn, meso- and pronephros. Shown are representatives of 50 embryos in each experiment. |
|
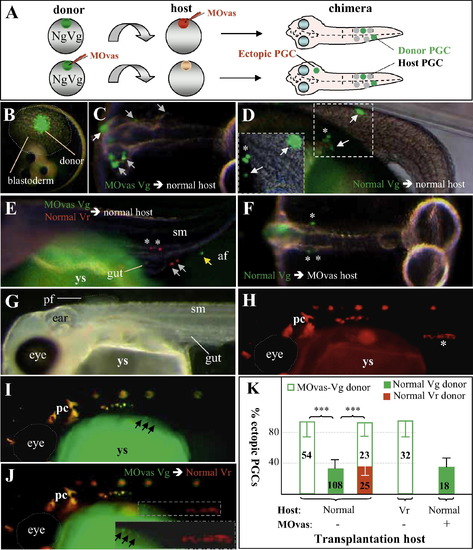
vasa controls PGC migration cell-autonomously by chimera assay. (A) Scheme of cell transplantation. Following zygotic MOvas injection, homozygous Vg donor blastula cells were transplanted into control non-transgenic (shown here) or transgenic Vr fish host blastulae. Donor PGCs (green) are daily monitored for normal (asterisks) and ectopic (arrows) distribution. In a reciprocal transplantation, non-transgenic embryos receive MOvas injection and used as the host to receive control Vg donor blastomeres. Ectopic PGCs are outside the migration route and gonad. (B–E) Transplantation into normal host. (B) Blastula immediately after transplantation showing approximately 50 GFP-positive donor cells among the host deep layer cells. (C) Chimera (2 dpf) from MOvas-injected donor, showing essentially all donor PGCs in ectopic sites. (D) Chimera (5 dpf) from transplantation between normal donor and host, showing normal as well as ectopic distribution of donor PGCs. (E) Chimeras (5 dpf) from cotransplantation of MOvas-injected Vg and non-injected Vr donors. RFP-positive PGCs from normal blastulae are seen both inside (asterisk) and outside (arrow) the gonad, whereas GFP-positive PGCs from vasa-depleted blastulae are outside in the anal fin (af). (F) Chimera (2 dpf) from reciprocal transplantation of normal Vg blastomeres into MOvas-injected non-transgenic hosts, showing normal distribution of vasa-depleted donor PGCs. (G–J) Chimera (7 dpf) by transplanting MOvas-injected Vg blastula cells into a normal Vr blastula. (G) Bright field micrograph. Clearly seen are many organs including the eye, ear, somites (sm), pectoral fin (pf) and gut. (H) Red fluorescent micrograph. Host PGCs are seen in the gonad. (I) Green fluorescent micrograph. Three vasa-depleted donor PGCs (arrows) are seen outside the gonad (insert). (J) Merged micrograph. The vasa-depleted donor PGCs do not colocalize with the host PGCs in the gonad. The insert shows the framed area at large magnification. Autofluorescent pigment cells (pc) and yolk sac (ys) are easily distinguishable from PGCs by morphology and location. (K) Statistical data of chimera assays. vasa knockdown of the donor (open column) is sufficient for ectopic PGC distribution regardless of whether the host environment is normal or vasa-depleted. For statistic analyses see the legend to Table 2. |
Reprinted from Mechanisms of Development, 126(5-6), Li, M., Hong, N., Xu, H., Yi, M., Li, C., Gui, J., Hong, Y., Medaka vasa is required for migration but not survival of primordial germ cells, 366–381, Copyright (2009) with permission from Elsevier. Full text @ Mech. Dev.


