
- Title
-
Proteolysis regulates cardiomyocyte maturation and tissue integration
- Authors
- Fukuda, R., Gunawan, F., Beisaw, A., Jimenez-Amilburu, V., Maischein, H.M., Kostin, S., Kawakami, K., Stainier, D.Y.
- Source
- Full text @ Nat. Commun.
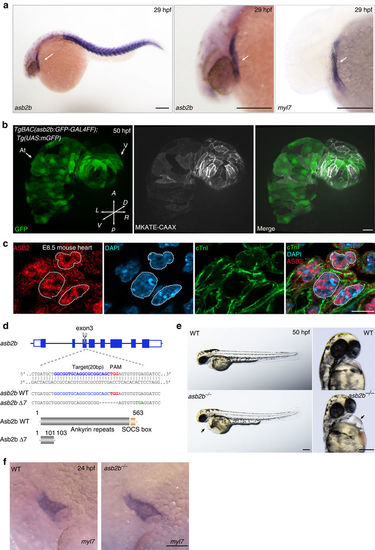
asb2b mutant zebrafish exhibit cardiac defects. (a) In situ hybridization for asb2b and myl7 expression in 29 hpf embryos. asb2b is expressed in the myl7+ heart tube (arrows) and in the somites. Lateral views, anterior to the left. Scale bars, 200 μm. (b) Three-dimensional images of 50 hpf Tg(asb2b:GFP-GAL4FF);Tg(UAS:mGFP);Tg(myl7:MKATE-CAAX) hearts. Scale bar, 40 μm. (c) E8.5 mouse heart co-stained for ASB2 (red), cardiac troponin I (cTnI, green) and 4,6-diamidino-2-phenylindole (DAPI; blue), showing nuclear and cytoplasmic localization of ASB2; dashed lines outline nuclei. Scale bars, 10 μm. (d) Schematic representation of the asb2b locus. The gRNA target sequence, PAM and premature stop codon are highlighted in blue, red and green, respectively. Deleted nucleotides are indicated by dashes. Predicted structure of WT and mutant (Asb2b Δ7) proteins. The asb2b Δ7 allele (asb2bbns33) is predicted to encode a truncated polypeptide containing two incorrect amino acids (102–103 aa). (e) Bright-field micrographs of 50 hpf WT and asb2b mutant embryos in lateral and ventral views. Black arrows point to pericardial edema. Scale bars, 200 μm (f) in situ hybridization for myl7 expression in 24 hpf WT and asb2b mutant. Scale bar, 100 μm. At, atrium; A, anterior; D, dorsal; L, left; P, posterior; R, right; V, ventricle; V, ventral. |
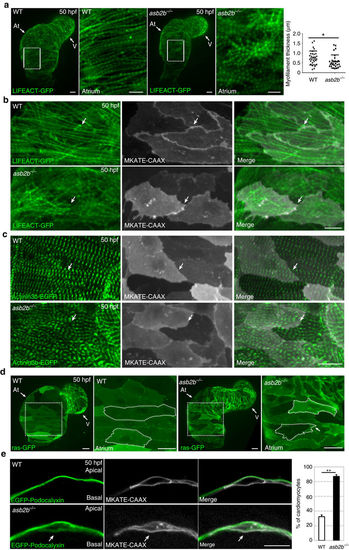
asb2b mutant cardiomyocytes exhibit structural defects. (a) Three-dimensional images of 50 hpf Tg(myl7:LIFEACT-GFP) WT and asb2b mutant hearts reveal differences in myofilament thickness and organization. Magnified views of myofilaments in white boxes are shown on the right. Myofilament thickness was measured in 50 hpf WT and asb2b mutant hearts (n=29 myofilaments from 5 hearts). (b) Three-dimensional images of 50 hpf Tg(myl7:LIFEACT-GFP);Tg(myl7:MKATE-CAAX) WT and asb2b mutant atria. The myofilaments in WT are organized across cell borders (arrows), whereas asb2b mutant hearts show disorganized myofilaments between adjacent cardiomyocytes (arrows). (c) Three-dimensional images of 50 hpf Tg(myl7:actn3b-EGFP) WT and asb2b mutant atria. Atrial cardiomyocytes in WT exhibit an organized z-band pattern across cell–cell borders (arrows), whereas those in asb2b mutants exhibit a disorganized z-band pattern (arrows). (d) Three-dimensional images of 50 hpf Tg(myl7:ras-GFP) WT and asb2b mutant hearts. Magnified views of myofilaments in white dotted boxes are shown on the right. Cardiomyocytes are outlined to define shape. (e) Single-plane images of 50 hpf Tg(myl7:EGFP-Podocalyxin);Tg(myl7:MKATE-CAAX) WT and asb2b mutant atria. In WT, EGFP-Podocalyxin is localized on the abluminal (apical) side of cardiomyocytes, whereas in asb2b mutants, it appears to be localized on both the abluminal and luminal (basal) sides (arrows). Number of cardiomyocytes exhibiting EGFP-Podocalyxin localization on the basal side in WT and asb2b mutant hearts (n=5 hearts, with averages taken from 20 cells per heart). *P<0.05 and **P<0.01 by one-way analysis of variance (ANOVA) followed by Tukey’s honest significant difference test. Error bars, s.e.m. Scale bars, 20 μm. At, atrium; V, ventricle. |
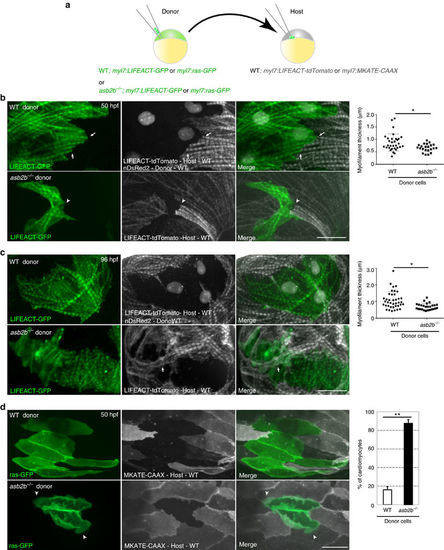
asb2b functions cell autonomously in cardiomyocytes. (a) Schematic representation of the transplantation experiments. (b) Three-dimensional images of 50 hpf chimeric atria. Tg(myl7:LIFEACT-GFP);Tg(myl7: nDsRed2) WT or Tg(myl7:LIFEACT-GFP) asb2b mutant donor cells were transplanted into Tg(myl7:LIFEACT-tdTomato) WT host embryos. WT donor cardiomyocytes show integration of the myofilaments into WT hearts (arrows), whereas those from asb2b mutants fail to meld into WT hearts (arrowheads). Myofilament thickness was measured in 50 hpf WT and asb2b mutant donor cardiomyocytes (n=32 (WT) and 22 (mutant) myofilament from 5 hearts). (c) Three-dimensional images of 96 hpf chimeric atria. asb2b mutant cardiomyocytes in WT hearts fail to integrate their myofilaments with those of adjacent cardiomyocytes. WT host cardiomyocytes appear to establish their myofilaments underneath asb2b mutant cardiomyocytes (arrows). Myofilament thickness was measured in 96 hpf WT and asb2b mutant donor-derived cardiomyocytes (n=39 (WT) and 26 (mutant) myofilament from 5 hearts). (d) Three-dimensional images of 50 hpf chimeric atria resulting from transplanting WT or asb2b mutant cells from Tg(myl7:ras-GFP) donors into Tg(myl7:MKATE-CAAX) WT hosts. asb2b mutant cardiomyocytes exhibit abnormal membrane protrusions (arrowheads). Number of WT and asb2b mutant donor-derived cardiomyocytes exhibiting membrane protrusions in 50 hpf WT hearts (n=5 hearts, with averages taken from 30 cardiomyocytes per heart.). *P<0.05 and **P<0.01 by one-way analysis of variance (ANOVA) followed by Tukey’s honest significant difference test. Error bars, s.e.m. Scale bars, 20 μm. |
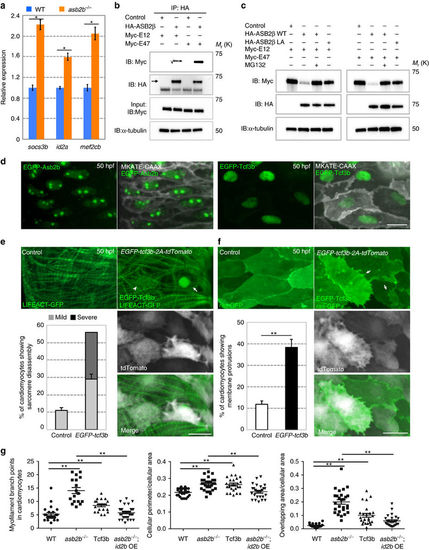
TCF3 is a target of ASB2 in cardiomyocytes. (a) Relative mRNA expression (qPCR) of socs3b, id2a and mef2cb in isolated 50 hpf WT (blue bar) and asb2b mutant (orange bar) hearts (n=2 technical replicates; RNA samples obtained from 500 isolated hearts). (b) Co-immunoprecipitation (IP) of HA-ASB2β and Myc-E12 or Myc-E47 immunoblotted (IB) for HA (arrow) or Myc. Rat NCMs were transfected with HA-Asb2β or control (mock), together with Myc-E12 or Myc-E47 adenovirus vectors. All adenovirus vectors used contain an independent GFP cassette to assess transfection efficiency. After 24 h of transfection, cells were treated with 20 μM MG132 for 8 h and then IP was performed; lower bands in HA blot are HA antibody heavy chains. (c) Asb2β induced E12 and E47 degradation in a proteasome-dependent manner. Rat NCMs were transfected with control, HA-Asb2β or HA-Asb2β L595A mutant (Asb2βLA), together with Myc-E12 or Myc-E47 adenovirus vectors. After 48 h of transfection, NCMs were treated with 20 uM MG132 or DMSO for 12 h and these protein samples were extracted for immunoblotting. (d) Three-dimensional images of a 50 hpf TgBAC(asb2b:GFP-asb2b);Tg(myl7:MKATE-CAAX) atrium, and a Tg(myl7:MKATE-CAAX) atrium expressing EGFP-Tcf3b. Both Asb2b and Tcf3 localize to the nucleus in cardiomyocytes. (e) Three-dimensional images of 50 hpf Tg(myl7:LIFEACT-GFP) and Tg(myl7:LIFEACT-GFP);Tg(myl7:EGFP-tcf3b-2A-tdTomato) atria. (The transgenic fish exhibit mosaic expression of EGFP-tcf3b-2A-tdTomato in the heart.) EGFP-Tcf3b-2A-tdTomato expressing cardiomyocytes exhibit disassembly of myofilaments. Arrow points to a severe case of myofilament disassembly, arrowhead to a mild case. Number of cardiomyocytes exhibiting sarcomere disassembly (n=5 hearts, with averages taken from 20 cardiomyocytes per heart). (f) Three-dimensional images of 50 hpf Tg(myl7:ras-GFP) or Tg(myl7:ras-GFP);Tg(myl7:GFP-tcf3b-2A-tdTomato) atria. Tcf3b-2A-tdTomato expressing cardiomyocytes exhibit abnormal membrane protrusions (arrows). Number of cardiomyocytes exhibiting membrane protrusions (n=5 hearts, with averages taken from 20 cardiomyocytes per heart). (g) Quantification of myofilament branch points, cellular morphology and membrane protrusions in 50 hpf WT, asb2b mutant, Tg(myl7:GFP-tcf3b-2A-tdTomato) WT and Tg(myl7:id2b-2A-tdTomato) asb2b mutant atrial cardiomyocytes in Tg(myl7:LIFEACT-GFP) or Tg(myl7:ras-GFP) background. (n=15 to 34 cardiomyocytes from 3 to 6 hearts). *P<0.05 and **P<0.01 by one-way analysis of variance (ANOVA) followed by Tukey’s honest significant difference test. Error bars, s.e.m. Scale bars, 20 μm. |
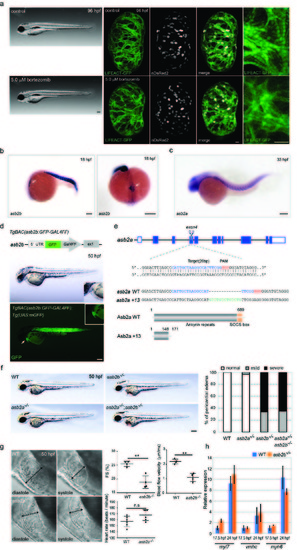
asb2b mutant zebrafish exhibit cardiac defects. (a) Brightfield micrographs of 96 hpf larvae treated with DMSO (control) and bortezomib. Lateral views, anterior to the left. Scale bar, 200 μm. 3D images of 96 hpf Tg(myl7:LIFEACTGFP) hearts in animals treated with DMSO (control) and bortezomib. Animals were treated from 24 until 96 hpf. Scale bar, 20 μm. (b) in situ hybridization for asb2b expression in 18 hpf embryos. Lateral view, anterior to the left; dorsal view, anterior to the bottom. asb2b is expressed in the heart cone (arrows) as well as in the somites. (c) in situ hybridization for asb2a expression in 33 hpf embryos. Lateral view, anterior to the left. Scale bars, 200 μm. (d) Schematic representation of the reporter transgene: a GFPGAL4FF- polyA-Kmr cassette was inserted at the ATG start codon in an asb2b BAC. Lateral views of a 50 hpf Tg(asb2b:GFP-GAL4FF);Tg(UAS:mGFP) embryo and close-up views of the heart; anterior to the left. An arrow points to the heart. GFP is expressed in the heart and somites. Scale bar, 200 μm. (e) Schematic representation of asb2a locus and the gRNA. Target sequence of gRNA and PAM are highlighted in blue and red, respectively. Inserted nucleotides are indicated in green. Predicted structure of WT and Asb2a +13 mutant proteins. asb2a +13 allele is predicted to encode a truncated polypeptide containing 25 incorrect amino acids (147-171 aa). (f) Bright-field micrographs of 50 hpf WT, asb2a mutant, asb2b mutant, and asb2a;asb2b double mutant embryos in lateral views. Scale bar, 200 μm. percentage of WT and mutant embryos exhibiting pericardial edema (n=50 fish). (g) Lateral close-up views of 50 hpf WT and asb2b mutant hearts in diastole and systole. Anterior to the left. Two-headed arrows indicate width of the ventricle. Quantification of ventricular fractional shortening (FS) and aortic blood flow velocity in WT and asb2b mutants. Heart rate measurement in 50 hpf WT and asb2b mutants (n=4 to 6 fish). Scale bar, 20 μm. (h) Relative mRNA expression (qPCR) of myl7, vmhc and myh6 expression at 17.5 and 24 hpf in WT and asb2b mutants (n=2 technical replicates, RNA samples were obtained from 50 embryos). **P<0.01 by one-way analysis of variance (ANOVA) followed by Tukey’s HSD test. Error bars, SEM. |
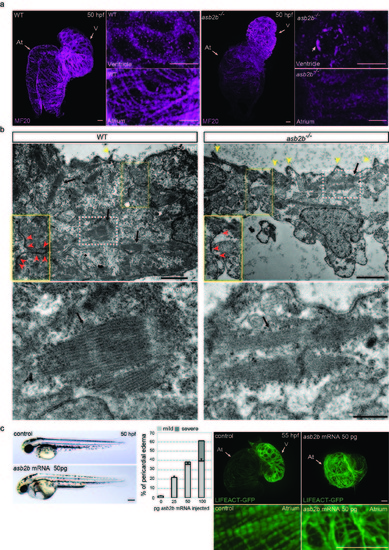
asb2b is involved in myofilament organization. (a) 3D images of 50 hpf WT and asb2b mutant hearts stained with myosin heavy chain antibody (MF20). At, atrium; V, ventricle. Cardiomyocytes in the WT ventricle exhibit cortical myosin localization, while those in asb2b mutants show less cortical localization of myosin and exhibit punctae of myosin (arrow). WT atrial cardiomyocytes exhibit clear myofilaments, whereas fewer myofilaments are observed in asb2b mutants. (b) Electron micrographs of 50 hpf WT and asb2b mutant ventricles. Close-up views of the cardiomyocyte cell-cell contact regions in yellow dotted boxes are shown (yellow squares with red arrowheads). Ventricular cardiomyocytes in asb2b mutants exhibit fewer regions of cell-cell contact (red arrowheads). asb2b mutant cardiomyocytes exhibit many more membrane protrusions (yellow arrowheads) compared to WT. Scale bars, 2 μm. Magnified views of myofilaments in white dotted boxes are shown (black arrows). Scale bar, 0.5 μm. (c) Lateral views of a 50 hpf control embryo and an embryo injected with 50 pg asb2b mRNA. Anterior to the left. Scale bar, 200 μm. Number of fish showing pericardial edema (n=60 fish). 1-cell stage embryos were injected with different amounts of asb2b mRNA and analyzed at 55 hpf. 3D images and close-up views of Tg(myl7:LIFEACT-GFP) hearts of 55 hpf embryos injected with 50 pg asb2b mRNA. At, atrium; V, ventricle. Error bars, SEM. Scale bars, 20 μm. |
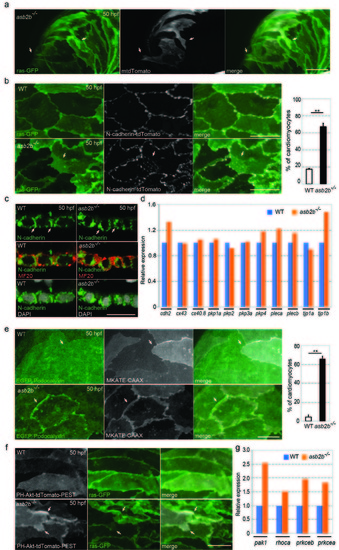
asb2b mutant cardiomyocytes exhibit irregular cell-cell junctions. (a) 3D images of 50 hpf Tg(myl7:ras-GFP) asb2b mutant atria mosaically expressing membrane-tdTomato (mtdTomato). Mosaic expression of mtdTomato was achieved by injecting a myl7:mtdTomato plasmid into Tg(myl7:ras-GFP) asb2b mutant one-cell stage embryos. Membrane protrusions of mtdTomato positive cardiomyocytes are shown (arrows). (b) 3D images of 50 hpf Tg(myl7:ras-GFP);Tg(myl7:N-cadherintdTomato) WT and asb2b mutant atria. N-cadherin-tdTomato molecules in WT cardiomyocytes exhibit lateral localization in cell-cell junctions, while those in asb2b mutants also exhibit localization in overlapping regions (arrows). Number of cardiomyocytes exhibiting N-cadherin-tdTomato punctae in overlapping regions with neighbouring cardiomyocytes in 50 hpf WT and asb2b mutant hearts (n =5 hearts, with averages taken from 25 cardiomyocytes per heart). (c) Co-staining for N-cadherin (green), Myosin heavy chain (MF20, red) and DAPI (white) in 50 hpf WT and asb2b mutant hearts, transverse views. No obvious differences in N-cadherin expression are observed (arrows). (d) Relative mRNA expression (microarray) of junction component genes in isolated 50 hpf WT and asb2b mutant hearts. Gene names can be found in Supplementary Table 1. (e) 3D images of 50 hpf Tg(myl7:EGFP-Podocalyxin);Tg(myl7:MKATE-CAAX) WT and asb2b mutant atria. In WT hearts, EGFP-Podocalyxin shows uniform distribution across cell-cell borders (arrows), while those in asb2b mutants exhibit peripheral localization (arrows). Number of cardiomyocytes exhibiting EGFP-Podocalyxin localization in cardiomyocyte cell-cell borders in 50 hpf WT and asb2b mutant hearts (n=5 hearts, with averages taken from 20 cardiomyocytes per heart). (f) 3D images of 50 hpf Tg(myl7:ras- GFP) WT and asb2b mutant atria expressing PH-Akt-tdTomato-PEST. asb2b mutant cardiomyocytes exhibit enriched localization of PH-Akt-tdTomato-PEST in membrane protrusions (arrows). (g) Relative mRNA expression (microarray) of pak1, rhoca, prkceb and prkcea in isolated 50 hpf WT and asb2b mutant hearts. Gene names can be found in Supplementary Table 1. **P<0.01 by one-way analysis of variance (ANOVA) followed by Tukey’s HSD test. Error bars, SEM. Scale bars, 20 μm. |
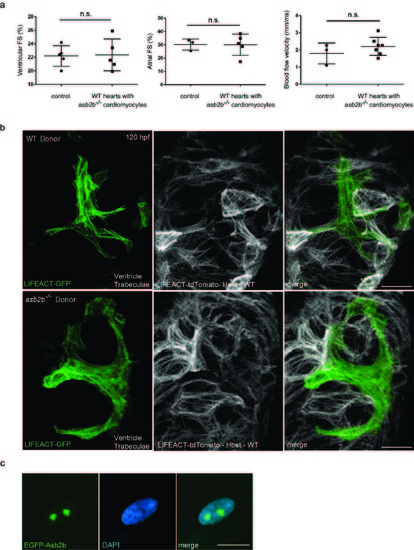
asb2b mutant cardiomyocytes in WT hearts exhibit disorganized myofilaments. (a) Quantification of fractional shortening (FS) in ventricles and atria in 50 hpf chimeric hearts, and aortic blood flow velocity. WT or asb2b mutant cells were transplanted into WT host embryos. No significant differences in FS or blood flow velocity were observed (n=3 to 7 fish). (b) 3D images of 120 hpf chimeric ventricles. Tg(myl7:LIFEACT-GFP) WT or asb2b mutant donor cells were transplanted into Tg(myl7:LIFEACT-tdTomato) WT host embryos. WT donor-derived cardiomyocytes exhibit mature sarcomeres in trabecular cardiomyocytes, while asb2b mutant-derived cardiomyocytes exhibit disorganized sarcomeres. (c) A 50 hpf TgBAC(asb2b:GFP-asb2b) heart stained with DAPI (blue). Scale bars, 20 μm. |
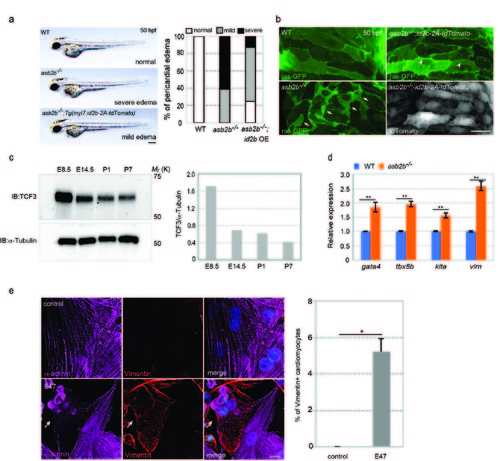
asb2b mutant and TCF3 overexpressing cardiomyocytes exhibit a number of phenotypes associated with cardiomyocyte dedifferentiation. (a) Brightfield micrographs of 50 hpf WT, asb2b mutant or Tg(myl7:id2b-p2a-tdTomato) asb2b mutant embryos in lateral views. Anterior to the left. Scale bar, 200 μm. Number of fish exhibiting pericardial edema (n=20 fish). (b) 3D images of 50 hpf Tg(myl7:ras- GFP) WT and asb2b mutant atria as well as Tg(myl7:ras-GFP);Tg(myl7:id2b-2AtdTomato) asb2b mutant atria. asb2b mutant cardiomyocytes exhibit irregular cell-cell borders and membrane protrusions (arrows), whereas id2b-overexpressing asb2b mutant cardiomyocytes exhibit less severe morphological phenotypes (arrowheads). (c) E8.5, E14.5, P1 and P7 mouse hearts were isolated and TCF3 protein levels were analyzed; relative expression levels shown on the right. (d) Relative mRNA expression (qPCR) of gata4, tbx5b, kita and vim in isolated 50 hpf WT (blue bar) and asb2b mutant (orange bar) hearts (n=2 technical replicates, RNA samples were obtained from 500 isolated hearts). (e) Rat NCMs transfected with control or E47 adenovirus vectors, co-stained for α-actinin (magenta), Vimentin (red) and DAPI (blue). Arrow points to a Vimentin-positive cardiomyocyte. Number of Vimentin-positive Rat NCMs (n=2, with averages taken from 50 cardiomyocytes). *P<0.05, **P<0.01 by one-way analysis of variance (ANOVA) followed by Tukey’s HSD test. Error bars, SEM. Scale bars, 20 μm. |