
- Title
-
Systemic inoculation of Escherichia coli causes emergency myelopoiesis in zebrafish larval caudal hematopoietic tissue
- Authors
- Hou, Y., Sheng, Z., Mao, X., Li, C., Chen, J., Zhang, J., Huang, H., Ruan, H., Luo, L., Li, L.
- Source
- Full text @ Sci. Rep.
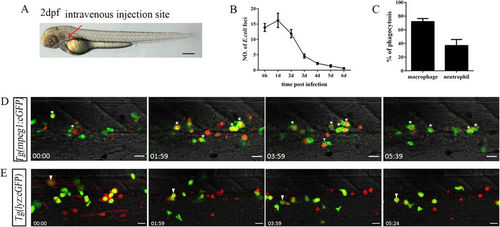
Bacterial (E. coli) phagocytosis by both macrophages and neutrophils following intravenous injection. (A), The intravenous injection site (red arrow) of E. coli (5–10 × 103 cfu) in 2 dpf embryo. Scale bars, 200 μm. (B), The numbers of Dsred+ E. coli foci in the CHT regions at different time points after injection (13.90 ± 1.31; 16.20 ± 2.35; 11.90 ± 1.33; 4.60 ± 0.65; 2.20 ± 0.33; 1.40 ± 0.40; 0.60 ± 0.22 at each time points; 10 embryos were counted in each group). (C), The percentage of macrophages (72.06 ± 4.44, N = 8) and neutrophils (36.93 ± 8.89, N = 8) involved in bacterial phagocytosis at 6 hpi in the CHT. (D,E), Time-lapse imaging of an infected Tg(mpeg1:eGFP) (D) or Tg(lyz:eGFP) (E) CHT from 0.5 hpi to 6 hpi. The white stars in (D) denote mpeg1-GFP+ macrophages that engulfed large amounts of Dsred+ E. coli. The white arrowheads in (E) indicate the initial aggregation of Dsred+ E. coli on the surface of lyz-GFP+ neutrophils, which were quickly phagocytosed. The red foci in (D,E) represent the phagocytosed bacteria. Scale bars, 20 μm. See also Video S1 and S2. |

Emergency granulopoiesis occurs following intravenous E. coli (5–10 × 103 cfu) infection. (A), The drastic expansion of SB+ neutrophils (red arrows) in the CHT of an infected embryo when compared with that treated with PBS at 2 dpi (4 dpf). (B), Calculation of the data obtained for SB+ neutrophils at different time points after infection (15.60 ± 2.80 vs 28.20 ± 5.27; 65.71 ± 10.60 vs 55.20 ± 4.76; 149.50 ± 8.70 vs 77.60 ± 9.45; 207.60 ± 39.15 vs 128.80 ± 15.00; 96.40 ± 23.80 vs 56.40 ± 6.33 in E. coli vs PBS group at each time point. N = 8 in each group). (C,D), Fluorescence images (C) and calculation (D) of lyz-GFP+ neutrophils in PBS (25.11 ± 2.58; N = 9) or E. coli (16.50 ± 1.84; N = 10) treated larval CHT at 6 hpi. The red signals indicate the bacteria phagocytosed by lyz-GFP+ neutrophils (white arrows). (E), The percentage of lyz-GFP+ neutrophils that are co-stained with TUNEL at 6 hpi (9.31 ± 1.87 vs 0.63 ± 0.37 in E. coli vs PBS group. N = 10 in each group). (F), Time-lapse imaging of an infected Tg(lyz:eGFP) CHT from 1 dpi to 1.5 dpi. Obvious generation, expansion and maturation of lyz-GFP+ neutrophils are observed. Scale bars, 20 μm. See also Video S4. 4a, 4b and 8a, 8b in (F) showing the dividing lyz-GFP+ cells. (G), SB+ signals (red arrows) in the runx1 mutant treated by either PBS or E. coli at 2 dpi (4 dpf). (H), WISH of pu.1 (red arrows) in the CHT of an embryo challenged with PBS or E. coli at 2 dpi (4 dpf). (I), The number of the pu.1+ myeloid progenitors at different time points after challenge (45.88 ± 5.87 vs 59.63 ± 4.29; 203.38 ± 5.02 vs 79.88 ± 8.70; 214.50 ± 13.98 vs 78.16 ± 6.89 in E. coli vs PBS group at each time point. N = 8 in each group). Scale bars, 20 μm. |

Reaction of HSPCs to different E. coli burdens after intravenous injection. (A), Fluorescence images showing the runx1-GFP+ cells in Tg(runx1:en-GFP) larvae treated with different volumes of E. coli at 2 dpi (4 dpf). Scale bars, 20 μm. (B), The number of runx1-GFP+ cells in larvae treated with 5–10 × 103 cfu E. coli or PBS. (70.31 ± 4.18 vs 71.14 ± 4.42; 148.8 ± 7.14 vs 137.6 ± 8.65 in E. coli vs PBS group at each time points. N ≥ 7 in each group). (C), Calculation of the runx1-GFP+ cells in (A) (137.6 ± 8.65; 194.6 ± 15.63; 148.8 ± 7.14; 103.4 ± 8.38 in each group. N ≥ 8 in each group). (D), WISH of cmyb (red arrows) in the larval CHT treated with different volumes of E. coli at 2 dpi (4 dpf). (E), The data obtained for cmyb+ cells at different time points after treatment with 5–10 × 103 cfu E. coli or PBS (102.80 ± 11.67 vs 82.40 ± 6.59; 114.00 ± 4.97 vs 112.00 ± 6.60; 121.60 ± 9.70 vs 127.00 ± 6.69; 129.00 ± 13.71 vs 127.60 ± 8.20; 203.80 ± 17.06 vs 226.40 ± 20.07 in E. coli vs PBS group at each time point. N = 8 in each group). (F), Calculation of the cmyb+ cells in (D) (221.60 ± 18.56; 268.70 ± 17.77; 203.80 ± 17.06; 89.30 ± 12.54 in each group. N = 10 in each group). |
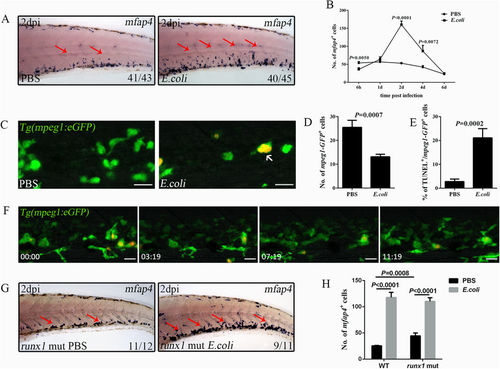
Emergency monopoiesis occurs upon intravenous E. coli (5–10 × 103 cfu) infection. (A), WISH of mfap4 (red arrows) in the CHT of a larva treated with PBS or E. coli at 2 dpi (4 dpf). (B), The data obtained for mfap4+ macrophages at different time points after challenge (36.13 ± 4.52 vs 53.88 ± 3.90; 64.25 ± 6.58 vs 57.00 ± 3.29; 160.44 ± 9.92 vs 53.20 ± 1.90; 87.00 ± 15.67 vs 42.44 ± 4.21; 24.71 ± 2.14 vs 23.00 ± 2.30 in E. coli vs PBS group at each time point. N ≥ 8 in each group). (C,D), Fluorescence images (C) and calculation (D) of mpeg1-GFP+ macrophages in PBS (25.50 ± 2.94; N = 8) or E. coli (13.13 ± 1.09; N = 8) treated larval CHT at 6 hpi. The red signals indicate the bacteria phagocytosed by mpeg1-GFP+ macrophages (white arrows). (E), The percentage of mpeg1-GFP+ macrophages that co-stained with TUNEL at 6 hpi (21.13 ± 3.86 vs 2.82 ± 1.05 in E. coli vs PBS group. N ≥ 10 in each group). (F), Time-lapse imaging of an infected Tg(mpeg1:eGFP) CHT from 1 dpi to 1.5 dpi (see also Video S5). (G-H), WISH (G) and calculation data (H) for mfap4+ macrophages (red arrows) in the runx1 mutant treated with either PBS or E. coli at 2 dpi (4 dpf) (WT: 117.9 ± 9.63 vs 25.38 ± 0.96 E. coli vs PBS; runx1 mut: 110.3 ± 6.88 vs 44.40 ± 5.72 E. coli vs PBS; N ≥ 5 in each group). Scale bars, 20 μm. |

Pu.1 suppresses emergency monopoiesis after intravenous infection of E. coli (5–10 × 103 cfu). (A), Time-lapse imaging of an infected 2 dpf pu.1G242D/G242D/Tg(lyz:eGFP) CHT from 6 hpi to 19 hpi. The white stars indicate that lyz-GFP+ neutrophils phagocytosed bacteria to form small foci. The white arrowheads represent free bacteria. The white cross star denotes the large E. coli foci. Scale bars, 20 μm (see also Video S7). (B,C), SB staining (B) and calculation of SB+ neutrophils (C) in the CHT of treated WT (172.90 ± 26.23 vs 77.10 ± 16.47 in E. coli vs PBS group. N = 8 in each group) or pu.1G242D/G242D larvae (198.00 ± 21.13 vs 140.80 ± 23.92 in E. coli vs PBS group. N = 8 in each group). (D,E), WISH (D) and calculation (E) of the pu.1+ myeloid progenitors in the CHT of stressed WT (214.50 ± 13.98 vs 78.10 ± 6.89 in E. coli vs PBS group. N = 8 in each group) or pu.1G242D/G242D larvae (230.30 ± 24.54 vs 187.00 ± 17.78 in E. coli vs PBS group. N = 8 in each group). (F,G), WISH (F) and calculation (G) of mfap4+ macrophages in the CHT of challenged WT (128.80 ± 7.32 vs 75.60 ± 5.09 in E. coli vs the group. N = 8 in each group) or pu.1G242D/G242D larvae (174.50 ± 14.03 vs 49.30 ± 3.12 in E. coli vs PBS group. N = 8 in each group). (H), The fold expansion of various cell types in both the infected WT (SB+: 2.24; pu.1+: 2.75; mfap4+: 1.70) or pu.1G242D/G242D (SB+: 1.41; pu.1+: 1.22; mfap4+: 3.54) at 2 dpi. (I), Kaplan–Meier survival analysis of PBS- and E. coli-treated WT and pu.1G242D/G242D embryos. The total numbers of animals used in each experiment are 100 (log-rank/Mantel–Cox statistic). Red arrows indicate WISH signals. |

Pu.1 deficiency causes excessive HSPC apoptosis after intravenous E. coli (5–10 × 103 cfu) infection. (A,B), Fluorescence images (A) and calculation (B) of runx1-GFP+ cells that phagocytose (white arrows) E. coli in the control (4.20 ± 0.79; N = 13) or pu.1 morphant (6.46 ± 1.0; N = 11) CHT at 6 hpi. (C), The fluorescence images of double staining by GFP and TUNEL in the CHT of PBS or E. coli-treated pu.1 morphants Tg(runx1:en-GFP) embryos at 2 dpi (4dpf). White arrows show the co-localization of TUNEL and GFP signals. (D), The percentage of TUNEL+/runx1-GFP+ in each group at 2 dpi (4 dpf) (Ctrl MO PBS: 0.48 ± 0.16; Ctrl MO E. coli: 0.36 ± 0.20; pu.1 MO PBS: 0.47 ± 0.14; pu.1MO E. coli: 1.07 ± 0.25. N ≥ 8 in each group). (E), WISH of cmyb (red arrows) in the CHT of the PBS or E. coli-treated pu.1 morphants at 2 dpi (4 dpf). (F), The numbers of cmyb+ cells in the CHT of treated control (230.80 ± 28.00 vs 248.80 ± 24.50 in E. coli vs PBS group. N = 10 in each group) or pu.1 morphants (154.40 ± 13.03 vs 306.60 ± 21.68 in E. coli vs PBS group. N = 10 in each group). (G) The numbers of cmyb+ cells in the CHT of the treated WT (203.80 ± 17.06 vs 226.40 ± 20.07 in E. coli vs PBS group. N = 10 in each group) or pu.1G242D/G242D embryos (164.80 ± 25.60 vs 291.70 ± 23.22 in E. coli vs PBS group. N = 10 in each group) at 2 dpi (4 dpf). |