
- Title
-
Zebrafish Model for Functional Screening of Flow-Responsive Genes
- Authors
- Serbanovic-Canic, J., de Luca, A., Warboys, C., Ferreira, P.F., Luong, L.A., Hsiao, S., Gauci, I., Mahmoud, M., Feng, S., Souilhol, C., Bowden, N., Ashton, J.P., Walczak, H., Firmin, D., Krams, R., Mason, J.C., Haskard, D.O., Sherwin, S., Ridger, V., Chico, T.J., Evans, P.C.
- Source
- Full text @ Arterio., Thromb., and Vas. Bio.

Flow cessation induces endothelial cell (EC) apoptosis in zebrafish embryos. A, Whole-mount active caspase-3 (red) staining of 30 hours post fertilization (hpf) flk1:EGFP-NLS zebrafish embryos (green EC nuclei) in the presence (control) or absence of flow (sih morpholino oligonucleotide [MO], tricaine). The region outlined with the white box is shown in higher magnification in B; white arrows indicate apoptotic ECs (yellow). C, Zebrafish embryo at 30 hpf. The region outlined with blue box represents the region that is studied in A. The percentage of EC apoptosis (D) and EC numbers (E) in sih MO-injected and tricaine-treated embryos compared with controls was quantified, and mean values are shown with SD; n≥15 from 3 independent experiments, **P<0.01 using 1-way ANOVA. A–C, Lateral view, anterior to the left, dorsal up. Scale bars, 50 μm (A), 15 μm (B), and 500 μm (C). |
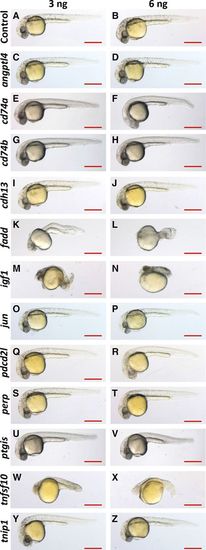
Morphology of morpholino oligonucleotide (MO)–injected embryos. A–Z, Zebrafish embryos were injected with 3 ng (left) or 6 ng (right) of gene-specific or nontargeting control MO (indicated on the left). Embryo morphology was observed during development and is shown here at 30 hours post fertilization. Lateral view, anterior to the left, dorsal up. Scale bar: 500 μm. PHENOTYPE:
|

Zebrafish functional screening of putative apoptotic regulators. A, Zebrafish embryos (flk1:EGFP-NLS embryos; green endothelial cell [EC] nuclei) were injected with morpholinos oligonucleotides (MOs) targeting candidate genes or a nontargeting control MO (indicated on the left of each row). EC apoptosis was studied in the presence (control MO) or in the absence (sih MO) of flow by whole-mount active caspase-3 staining (red). Apoptotic ECs (yellow) were monitored at 30 hours post fertilization (hpf). Lateral view, anterior to the left, dorsal up. Scale bar: 50 μm. B, The proportion of apoptotic ECs (number of apoptotic ECs divided by the total number of ECs) normalized to sih MO-injected embryos was calculated, and mean values are shown with SEM. n≥15 from 3 independent experiments. *P<0.05, **P<0.01, ***P<0.001 using 1-way ANOVA. EXPRESSION / LABELING:
PHENOTYPE:
|

ZFIN is incorporating published figure images and captions as part of an ongoing project. Figures from some publications have not yet been curated, or are not available for display because of copyright restrictions. PHENOTYPE:
|

Silent heart embryos do not exhibit hypoxia. The hypoxic response was monitored in transgenic embryos containing a hypoxia reporter Tg(phd3::GFP). Embryos deficient in von Hippel-‐Lindau (vhl) tumour suppressor gene expression were used as a positive control. Vhl-/- embryos exhibit a systemic hypoxic response, reflected by upregulation of GFP expression. No upregulation of GFP expression was observed in sih embryos lacking blood flow compared to controls. White arrowheads indicate mild GFP fluorescence in the brain region. Lateral view of 3 day old embryos. |
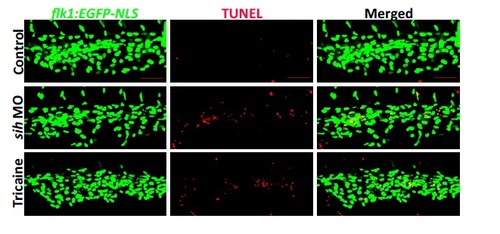
Flow cessation induces EC DNA fragmentation in zebrafish embryos at 30 hpf. Whole-‐mount TUNEL staining (red) of 30 hpf flk1:EGFP-NLS embryos (green EC nuclei) in the presence (control) or absence of flow (sih MO, tricaine). Lateral view, anterior to the left, dorsal up. Scale bar: 50 μm. |
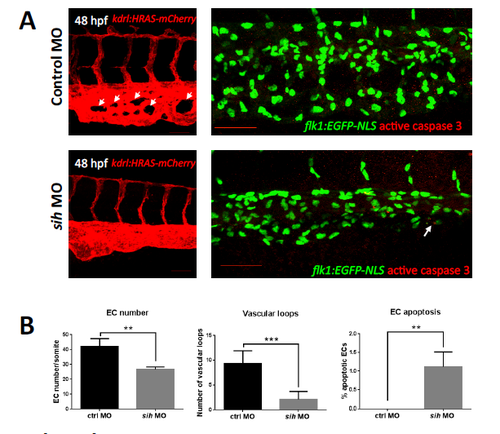
Flow cessation reduces the complexity of the caudal plexus in zebrafish embryos at 48 hpf. Whole-‐mount active caspase-‐3 staining (red) of 48 hpf flk1:EGFP-NLS embryos (green EC nuclei) and assessment of vascular morphology of 48 hpf kdrl:HRAS- mCherry (red EC) embryos in the presence (control) or absence of flow (sih MO). (A) Representative images are shown. Caudal vein plexus morphology was less complex and with fewer loops (indicated with white arrows) in the absence of flow (sih MO) compared to controls (left panels). A modest increase in apoptotic EC was observed in sih MO compared to controls (right panels). (B) EC numbers, number of vascular loops and percentage of apoptotic ECs were quantified in sih embryos and controls at 48 hpf and are presented as mean values with standard deviation. n≥15 from three independent experiments; **p<0.01, ***p<0.001 using an unpaired two-‐tailed t-‐test. |
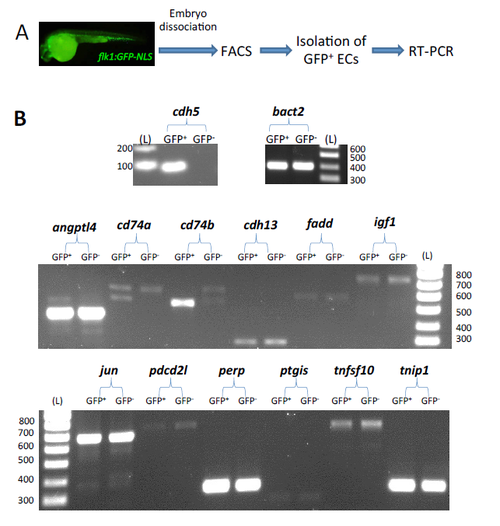
Isolation of ECs from zebrafish embryos and measurement of candidate gene expression by RT-PCR. (A) ECs were isolated from 26 hpf flk1:EGFP-NLS zebrafish embryos using fluorescence-‐activated cell sorting (FACS). (B) Expression of EC marker cdh5, house-‐keeping gene beta-‐actin (bact2) and candidate genes of interest was assessed in ECs (GFP+) by RT-‐PCR followed by analysis of product by gel electrophoresis, while GFP-‐ cells were used as a control. The DNA fragment sizes are indicated in base pairs next to the DNA ladder (L). |

Design and validation of second non-overlapping MOs to target angptl4, cdh13, pdcd2l and perp. (A) Diagramatic representation of angptl4, cdh13, pdcd2l and perp pre-mRNAs with exons (numbered boxes) and introns (solid lines). Exon and intron sizes are arbitrary. The regions in pre-mRNA where MOs bind are indicated with black bars labelled MO1 or MO2. (B) Zebrafish embryos were injected with second non-overlapping MO (MO2) for each gene of interest. The ability of angptl4 MO2, cdh13 MO2 and pdcd2l MO2 to modify splicing of the targeted transcript was assessed by analysis of RT-PCR products after agarose gel electrophoresis. Splicing modifications were observed as a band shift or as a reduction of the wildtype band compared to the control sample (ctrl MO). RT-PCR analysis of beta-actin (bact2) was used as an internal control. The DNA fragment sizes are indicated in base pairs next to the DNA ladder (L). (C) Embryos with residual expression of the wildtype transcript (angptl4 MO2 in (B)) were additionally tested by qPCR to validate MO efficiency. Mean values are shown with standard error of the mean from three independent experiments. ***p<0.001, using an unpaired two-tailed t-test. (D) Embryos injected with either perp MO or a non-overlapping MO (MO2) exhibited bursting of yolk cell during dechorionation using forceps, which was not observed in control embryos. Embryos are shown at 30 hpf, lateral view, anterior to the left, dorsal up. Scale bar: 500 μm. |