
- Title
-
Wnt9a Is Required for the Aortic Amplification of Nascent Hematopoietic Stem Cells
- Authors
- Grainger, S., Richter, J., Palazón, R.E., Pouget, C., Lonquich, B., Wirth, S., Grassme, K.S., Herzog, W., Swift, M.R., Weinstein, B.M., Traver, D., Willert, K.
- Source
- Full text @ Cell Rep.
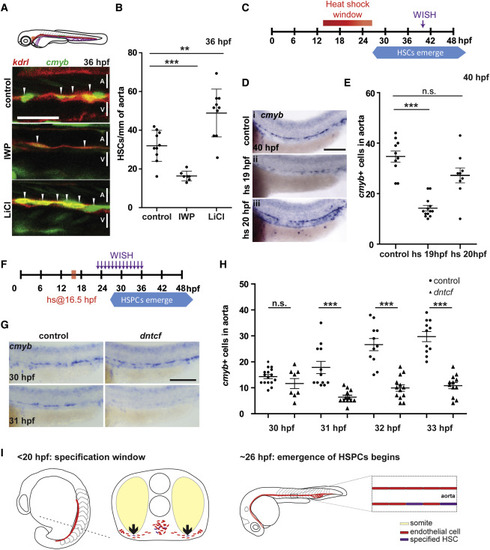
Wnt Signaling Is Required Transiently Prior to 20 hpf for HSPC Development (A) kdrl:mCherry; cmyb:eGFP fish were treated with IWP-L6 or LiCl to inhibit and activate Wnt signaling, respectively ( van de Water et al., 2001 and Wang et al., 2013), from 10 hpf to 36 hpf and imaged at 36 hpf. A, aorta; V, vein. Scale bar, 30 μm. (B) Quantitation of HSPCs per millimeter of aorta. (C) Schematic of heat shock regimen. (D) hsp:dntcf fish were heat shocked every hour from 13 hpf to 24 hpf, fixed at 40 hpf, and analyzed for cmyb expression by WISH. Scale bar, 100 μm. (E) Quantitation of cmyb+ cells from (D). (F) Schematic of experimental layout. (G) hsp:dntcf fish were heat shocked at 16.5 hpf, pools were fixed every hour from 23 to 36 hpf, and they were analyzed for cmyb expression by WISH. Scale bar, 100 μm. (H) Quantitation of cmyb+ cells from (G). (I) HSPCs are specified as endothelial cells ingress toward the midline. Endothelial cells receive specification cues, at least in part, from somatic cells. At 26 hpf, HSPCs start to emerge from the floor of the dorsal aorta. A, aorta; V, vein. ∗∗p < 0.01; ∗∗∗p < 0.001; n.s., not significant. Error bars represent SD. See also Figure S1. |
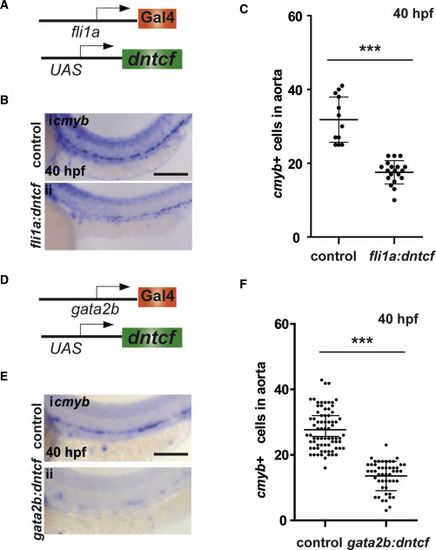
Wnt Cue Is Required in Cells of the HE (A) Schematic of transgenic elements used for endothelial specific expression of dntcf in endothelial cells. (B) WISH for cmyb at 40 hpf in control and in fli1a:Gal4; UAS:dntcf fish. (C) Quantitation of cmyb+ cells from (B). (D) Schematic of transgenic elements used for endothelial specific expression of dntcf in the HE. (E) WISH for cmyb at 40 hpf in control and in gata2b:Gal4; UAS:dntcf fish. (F) Quantification of cmyb+ cells from (E). ∗∗∗p < 0.001. Scale bars, 100 μm. Error bars represent SD. See also Figure S2. |

Wnt9a Is Required for HSPC Formation (A and B) WISH for wnt9a at 16.5 hpf, 19 hpf, and 24 hpf (A). Scale bars, 0.2 mm; representative images of n = 15. Imaged area is shown in (B). (C and D) Representative images of kdrl:mCherry; cmyb:eGFP injected as listed (C). HSPCs per millimeter of aorta are quantified in (D). Scale bars, 30 μm. (E) WISH for cmyb in 4 days post fertilization (dpf) fish treated with 0.1 ng or 1 ng of wnt9a MO. Scale bars, 0.2 mm. (F) Wnt9a mutants were generated by injection of guide RNA targeting the last portion of the first exon. (G and H) Expression of cmyb was examined by WISH in 36 hpf WT, wnt9a+/Δ and wnt9aΔ/Δ- zebrafish (G) and quantified in (H). Scale bars, 100 μm. ∗p < 0.05; ∗∗∗p < 0.001; n.s., not significant. Error bars represent SD. See also Figure S3. EXPRESSION / LABELING:
|

HSPCs Expand in the Aorta (A) The heart tubes of gata2b:GFP fish were injected with 1 nL of 10 mM EdU at 26 hpf, and fixed and stained for cells that had divided as well as GFP at 33 hpf (n = 10). (B) Representative confocal image of gata2b+ cells that have undergone cell division in the aorta (arrowheads). (C–E). gata2b:GFP;kdrl:mCherry fish were treated with 10 μM 5′ fluorouracil (5FU) from 24 to 35 hpf (C), confocal imaged at 36 hpf (D), and gata2b+ cells quantified (E). (F and G) G1 arrested (mCherry+) endothelial cells (GFP+) from wnt9a morphant and control fish (n = 100 embryos per condition) were collected by FACS at 28 hpf (F) and compared by qPCR for gata2b (G). Scale bars, 30 μm. Error bars represent SD. See also Figure S4. |
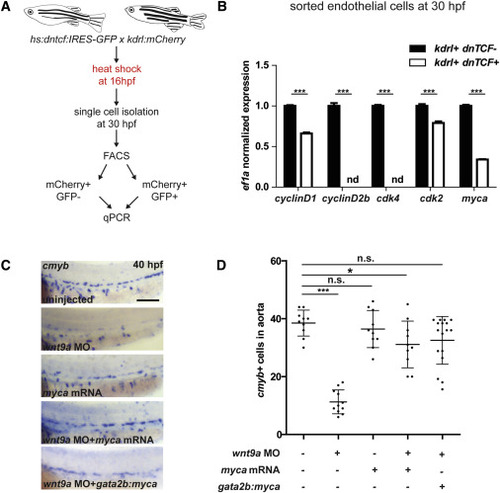
Wnt9a Affects Endothelial gata2b+ G1-S Cell Cycle Progression through myca (A) Endothelial cells (mCherry+) were collected by FACS from hs:dntcf:IRES-GFP; kdrl:mCherry fish at 30 hpf after heat shock at 16 hpf (n = 100 embryos per condition). (B) Wnt inhibited (dntcf;GFP+) cells were compared to control (GFP−) cells by qPCR after being sorted by FACS. (C and D) AB∗ fish were injected with wnt9a MO, myca mRNA, or both; phldb4:Gal4 fish were injected with wnt9a MO, UAS;myca plasmid, and transposase mRNA, fixed at 40 hpf, analyzed by WISH for cmyb (C), and quantified in (D). Scale bar, 100 μm. ∗p < 0.05; ∗∗∗p < 0.001; n.s., not significant. Error bars represent SD. See also Figure S5. |

Wnt Signaling affects HSPCs. A. kdrl:mCherry; 7X TCF:eGFP fish were imaged at 26 hpf. Scale bar= 30µm. B. The dosages used did not alter overall morphology or vasculature as measured by expression of the vascular marker kdrl:mCherry. Scale bar= 30µm. C. Trunk and tail tissue from wildtype AB* fish under the same treatment regimen were examined; an effect on Wnt signaling was confirmed at 34 hpf by qPCR for expression of the Wnt target gene axin2 (n=15). HSPCs were examined by qPCR at 34 hpf for marker cmyb (D. n=20) in dissected trunks and tails of larvae. E. hsp:dntcf fish were heat shocked and compared to AB* for axin2 by qPCR to assess Wnt activity following dntcf induction (n=20 at each time point) (F). G. AB* zebrafish were treated with IWP-L6 or LiCl from 18-22 hpf and analyzed at 40 hpf by WISH for cmyb. Scale bar= 0.1mm. H. HSPCs were examined by qPCR at 26 hpf for marker runx1 (n=20). I. hsp:dntcf fish were heat shocked at 13 hpf and analyzed for runx1 (n=30), compared to AB* controls. J. hsp:dntcf fish were heat shocked at 13 hpf and analyzed for cmyb at 29 hpf, compared to AB* controls. Scale bar= 0.1mm ****P<0.0001, n.s.=not significant. Error bars represent standard deviation. |

Apoptosis in the aorta and validation of UAS:dntcf and UAS:CA-β-catenin lines. A. hs:dntcf; kdrl:mCherry fish were examined for apoptosis by TUNEL assay at 32 hpf after a 10 minute heat shock at 16.5 hpf. Scale bar= 30µm. B. The UAS:dntcf line was validated by crossing it to hsp:Gal4 fish and heat shocking at 38°C for 30 minutes at 13 hpf, which results in severe axial truncations, shown at 36 hpf. Scale bar= 100µm. C. To assess the effect of Wnt activation in the endothelium on HSC development, we generated a transgenic zebrafish line (UAS:CA-β-catenin) carrying a constitutively active form of β-catenin (CA-β-catenin) under the control of a drug inducible, endothelial specific Gal4 driver (fli1a-EcR), where Gal4 is shuttled to the nucleus after Tebufenozide (Swift et al., 2014). D. Activation of the transgenes (UAS:CA-β-catenin; fli1a-EcR; UAS:eGFP) was monitored by GFP expression in the heart and vasculature. Scale bar= 30µm E. Expression of CA-β-catenin was detectable 30 minutes after treatment by reverse transcription quantitative PCR (qPCR). F. UAS:CA-β-catenin; fli1a- EcR fish were analyzed at 40 hpf by WISH for cmyb after treatment from 10-40 hpf with 0.2µM Tebufenozide. Scale bar= 0.1mm. |

qPCR screen results and wnt9a morpholino validation. GFP+ cells were sorted by FACS from 16.5 (A, C) and 20 (B, C) hpf myf5:eGFP embryos (n=200 at each time point), RNA isolated and qPCR performed for Wnt genes. Knockdown of wnt9a was achieved with a MO (D). Intron retention was verified by PCR (n=10 at each dosage) (E). F. Loss of canonical Wnt activity was verified by qPCR for axin2 on whole embryos (n=30) at 30 hpf. G. The wnt9a MO did not affect formation of the aorta (30 hpf hey2; 26 hpf dll4) vasculature (26 hpf msr; 24 hpf flk,), or pronephros (24 hpf cdh17). Examination of HSPC marker runx1 at 26 hpf by WISH (H) and qPCR (n=20) (I) in wnt9a morphants, compared to uninjected controls. J. Examination of HSPC marker cmyb at 42 hpf by WISH in wnt9a morphants in the presence or absence of somitic wnt9a, compared to uninjected controls. K. Quantification of cmyb+ cells from J. Scale bars=0.1 mm. *P<0.05, ****P<0.0001, n.s.=not significant. Error bars represent standard deviation. |
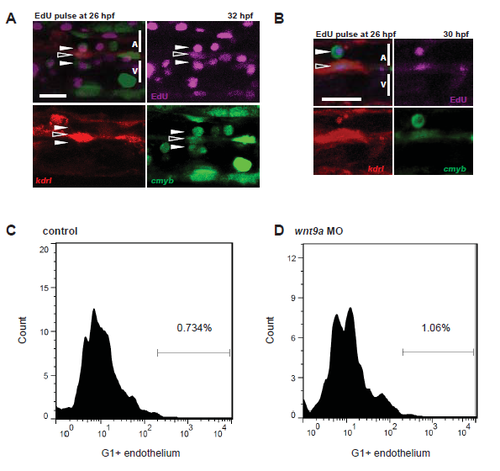
Proliferation in the aorta. kdrl:mCherry; cmyb:GFP fish were injected with 10mM EdU at 26 hpf and examined by confocal microscopy for GFP+;mCherry+ cells that had proliferated (EdU+, purple) by 32 hpf (A. n=10) or 30 hpf (B. n=10). Open arrows indicate nascent HSPCs, while closed arrows indicate HSPCs that are undergoing EHT. FACS histograms in control (C) and Wnt9a morphant (D) fish sorted for G1 (mCherry+) and endothelium (GFP+). Note the increase in endothelial cells in the G1 fraction of wnt9a morphants. Scale bars= 30µm. Error bars represent standard deviation. |