
- Title
-
Analysis of cellular behavior and cytoskeletal dynamics reveal a constriction mechanism driving optic cup morphogenesis
- Authors
- Nicolás-Pérez, M., Kuchling, F., Letelier, J., Polvillo, R., Wittbrodt, J.,Martínez-Morales, J.R.
- Source
- Full text @ Elife
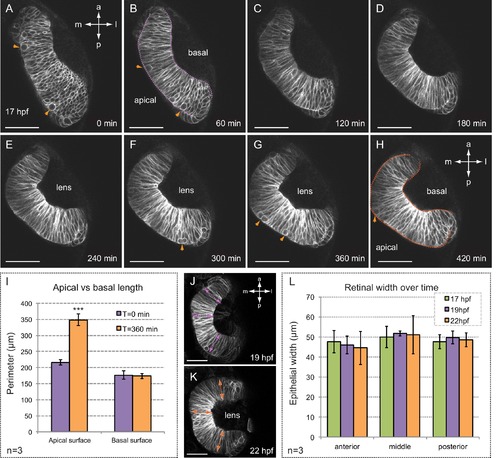
Folding of the retinal epithelium in zebrafish. (A–H) Time series of optical sections show the progression of retinal morphogenesis starting at 17 hpf (dorsal view) in a tg(vsx2.2:GFP-caax) embryo. Arrowheads point to mitotic divisions at the apical surface. Apical and basal edges are indicated at 60 (purple) and 420 (orange) min. See also Video 1. (I) Quantification of the perimeter of the apical and basal edges between 18 and 24 hpf. (J–L) Retinal width remains constant throughout retinal folding as revealed in tg(vsx2.2:GFP-caax) embryos. Error bars indicate s.d. of the mean. (n = 3; T-test). Antero-posterior and medio-lateral axes are indicated. Scale bars = 50 µm. |
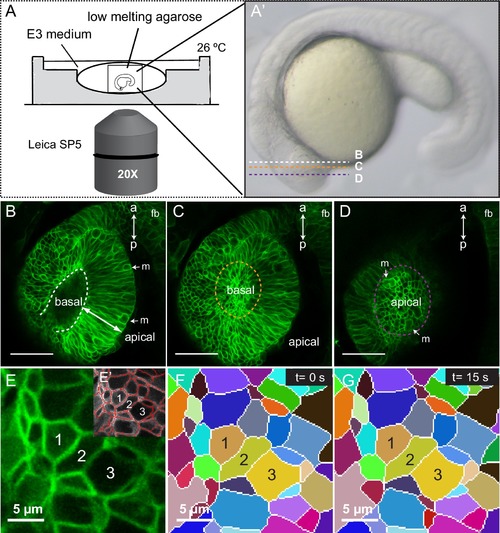
Imaging setup and segmentation. (A, A’) Schematic representation of the imaging setup. Confocal planes for panels B–D are indicated in A’. (B–D) Optical sections through a 20 hpf tg(vsx2.2:GFP-caax) retina showing basal (orange in C) and apical (purple in D) planes. Mitotic figures (m) and antero-posterior axis (a–p) are indicated. fb = forebrain. (E–G) Automatic cell segmentation (E–E’) and manual tracking of the segmented cells through time (F, G) are shown. Scale bars = 50 µm in B–D and 5 µm in E–G. |
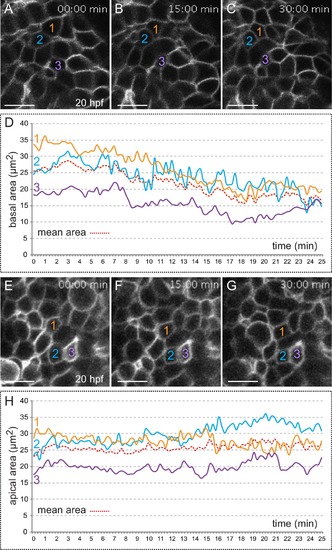
Quantitative analysis of membrane oscillations in tg(vsx2.2:GFP-caax) embryos. Cell area dynamics at the basal (A–-D) and apical (E–H) surfaces is shown for three individual cells (color coded). Absolute basal (D) and apical (H) areas in µm2 are represented versus time for the individual cells. The mean area indicates a progressive constriction of the basal, but not apical surfaces over time (D, H). Scale bars = 10 µm. |
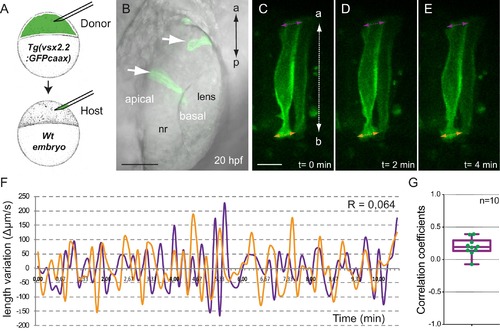
Analysis of tg(vsx2.2:GFP-caax) clones show uncoupled oscillations at apical and basal surfaces. (A) Scheme of transplantation experiment at sphere stage. (B) Confocal microscopy image showing transmitted light and GFP expression for transplanted clones (white arrows) at 20 hpf. Antero-posterior (a–p) axis is indicated. (C–E) Confocal microscopy time-lapse images show length variation of basal (orange) and apical (purple) edges through time in a transplanted clone. The orientation of the apico-basal (a–b) axis is indicated. Scale bars = 50 µm in B and 10 µm in C–E. (F) Quantification of the basal (orange) and apical (purple) length variation for an individual clone showing no correlation between the oscillations (R = 0064). (G) Box plot showing the distribution of apical vs basal oscillations correlation coefficients for 10 transplanted neuroblasts from five different retinas. |
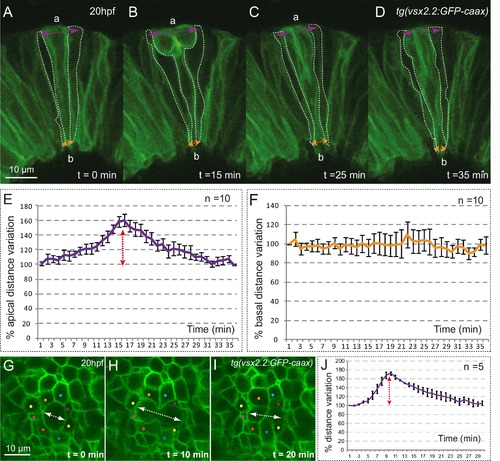
Mitotic rounding impact on basal constriction and apical expansion. (A–D) Confocal microscopy time-lapse images showing a mitosis in a tg(vsx2.2:GFP-caax) retina at 20 hpf. Dashed white lines highlight flanking cells. Arrows indicate apical (purple) and basal (orange) distance variation. The orientation of the apico-basal (a–b) axis is indicated. (E–F) The graphs show the quantification of distance variation (%) for the apical (E) and basal (F) sides. The mitotic event (red arrow) results only in a transient expansion of the apical domain. Error bars indicate standard error of the mean (n = 10, from three different retinas). (G–I) Confocal microscopy time-lapse images showing a mitosis occurring in the apical plane in a tg(vsx2.2:GFP-caax) retina at 20 hpf. Dashed white arrows indicate apical distance variation along the mitotic axis. Neighboring cells are indicated with colored dots. (J) Quantification of apical distance variation (%) along the mitotic axis for five different cells confirms a transient expansion of the apical domain. Scale bars = 10 µm. |
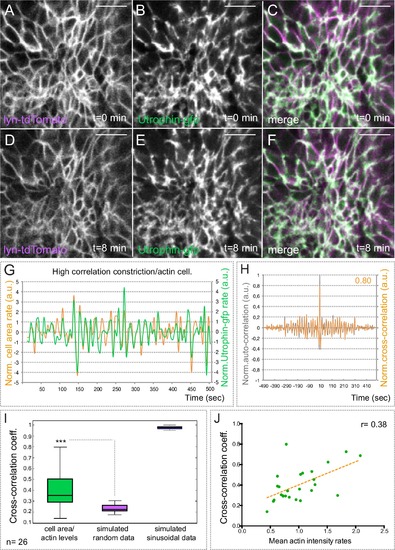
Basal actin dynamics in constricting retinal cells. (A–F) Actin dynamics, as revealed by utrophin-gfp, and membrane oscillations were simultaneously examined by time lapse in the line tg(vsx2.2:lyn-tdTomato) at 20 hpf (see Video 4). Note that F-actin localizes mainly at the cellular cortex. Scale bars = 10 µm. (G) Normalized basal area rate (orange) and normalized utrophin-gfp rate (green) are shown over time for a cell displaying a high correlation between actin oscillations and membrane expansion. Area rate and Utrophin-gfp rate were normalized dividing by the mean of their absolute values. (H) Normalized auto-correlation (grey line) and cross-correlation (orange) are shown for cell represented in G. Maximum cross-correlation (0.8) is indicated. (I) Box plot comparison of cross-correlation results between actin vs. membrane oscillations, simulated random and simulated sinusoidal signals shows a significant (p<0.001; T-test; n = 26) positive correlation between actin accumulation and basal area expansion. (J) Scattered plot showing the dependency of cross-correlation coefficients (n = 26) on mean actin intensity rates. Linear regression line (orange) and linear correlation coefficient (0.38) are indicated. |
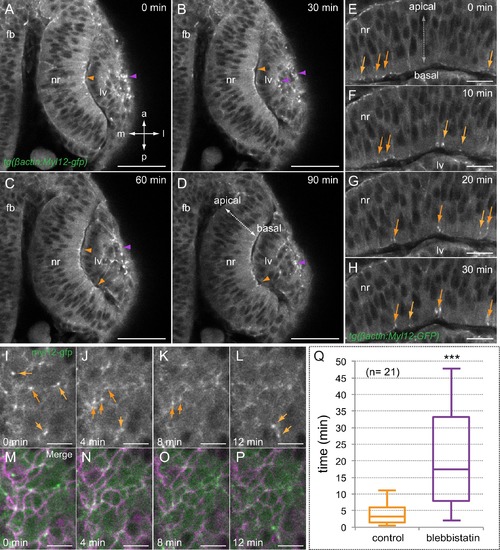
Myosin accumulates in basal foci during optic cup morphogenesis. (A–D) Live-imaging analysis of tg(actb1:myl12.1-eGFP) embryos reveals myosin accumulation at the apical lens (purple arrowheads) and basal retina (orange arrowheads) between 19 and 20.5 hpf. Antero-posterior (a–p) and medio-lateral (m-l) axes are indicated. (E–H) Myosin accumulates in transient foci (orange arrows) at the basal cortex. (I–P) Time-lapse analysis of myosin foci at the basal surface plane in embryos injected with lyn-tdTomato RNA reveals that the protein accumulates at the peripheral cortex in scattered cells. (Q) The box plot shows a significant difference in foci stability between control and blebbistatin (150 µM) treated embryos (T-test, n = 21). fb = forebrain; nr = neural retina; lv = lens vesicle. Scale bars = 50 µm in A–D, 20 µm in E–H, and 10 µm in I–P. |
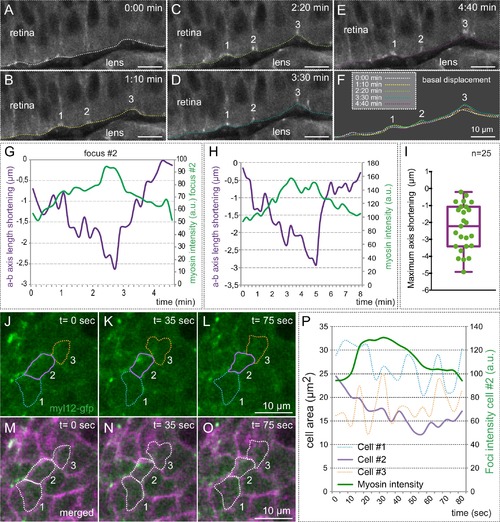
Myosin accumulation correlates with basal membrane displacement. (A–E) Time series of optical sections from tg(actb1:myl12.1-eGFP) embryos show discrete myosin foci (labeled 1, 2, 3) and basal surface displacement. (F) Basal edges were color-coded for each time point and overlapped to illustrate the transient indentations of the basal surface associated to myosin foci. (G–H) Quantitative recording over time of myosin intensity and apico-basal axis shortening for a couple of representative foci. The focus in G is #2 in A–F. (I) Box plot showing the maximum shortening of the a-b axis for 25 foci from 12 different retinas. (J–O) Correlative analysis of basal area (revealed by lyn-tdTomato) and myosin dynamics is shown for three neighbor cells (color-coded). (P) Quantitative analysis of cell area changes and myosin intensity for the three neighboring cells. Note that only the cell accumulating myosin contracts. Scale bars =10 µm. |
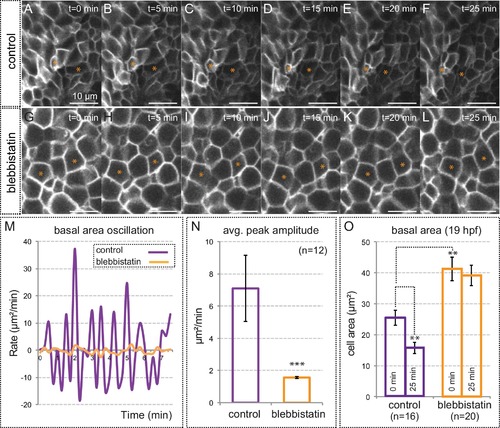
Myosin inhibition impairs basal constriction. (A–L) Live-imaging analysis of cell area dynamics in control (A–F) and blebbistatin-treated (G–L) tg(vsx2.2:GFP-caax) embryos. Progressive constriction is observed in individual cells (asterisk) in control, but not in blebbistatin-treated tissue. (M) Basal area variation rate is shown for representative control and blebbistatin-treated cells. (N) Average peak amplitude of the cell area rate is considerably reduced in treated cells (T-test, n = 12). (O) Blebbistatin treatment significantly inhibited basal constriction over a considered period of 25 min, blocking the cells in a relaxed state (T-test). Scale bars = 10 µm. |
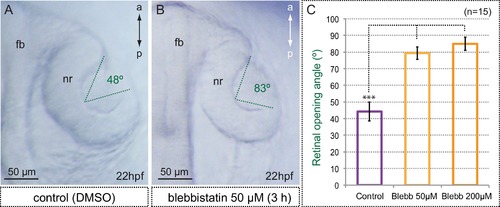
Myosin inhibition interferes with optic cup folding. (A,B) Optic cup folding is also impaired in blebbistatin-treated embryos as assessed by the retinal opening angle (indicated with green dashed lines). (C) Quantitative analysis of retinal opening angles show a significant delay in optic cup folding in embryos treated with 50 and 200 µM blebbistatin (one-way ANOVA followed by Tukey test, n = 15). fb = forebrain; nr = neural retina. Scale bars = 50 µm. |
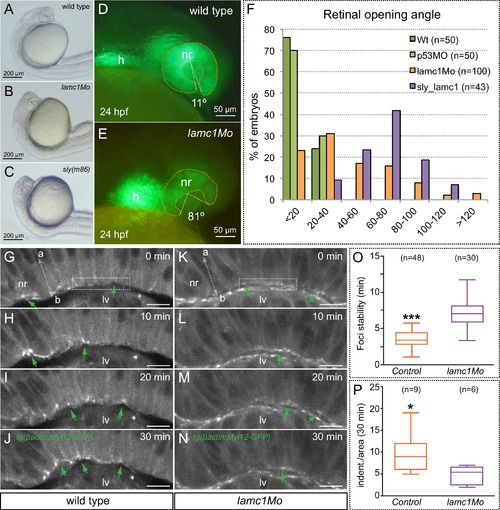
Optic cup folding, basal contractility and myosin dynamics depend on lamc1 function. (A–C) General embryo morphology for wild type, lamc1 morphants and sly (lamc1-/-) mutants at 24 hpf. Retinal opening is indicated with a dashed line. (D–E) Retinal morphology in tg(vsx2.2:GFP-caax) both wild type and lamc1Mo-injected embryos, at 24 hpf. Ventral opening angle (white) and retinal contour (orange) are indicated with dashed lines. (F) Frequency distribution of retinal opening angles is shown for controls (either wild type or p53Mo-injected), lamc1Mo injected, or sly mutants. (G–N) Time-lapse analysis of tg(actb1:myl12.1-eGFP) wild type and lamc1Mo-injected embryos show dynamic accumulation of myosin foci (green arrows) at the basal surface. (O) Analysis of myosin foci reveals that they are significantly more stable in lamc1Mo-injected embryos (T-test). (P) The box plot shows that transient indentations of the basal surface are significantly diminished in lamc1Mo-injected embryos (T-test). h = heart; nr = neural retina; lv = lens vesicle. Scale bars = 200 µm in A–C, 50 µm in D–E, and 10 µm in G–N. |
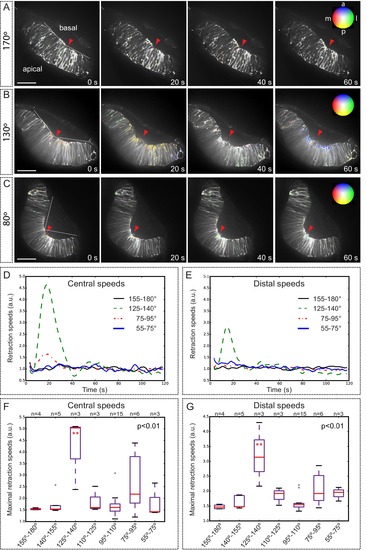
Optical flow analysis of tissue displacement upon laser ablation at different stages of folding. (A–C) Analysis of pixel displacement after laser ablation at the basal surface is shown for retinas at 170°, 130°, and 80° of bending. Red arrowheads indicate the ablation point. Particles’ motion vectors are indicated with a color code: Colors correspond to the direction of the displacement and color intensity to its magnitude. Note maximum displacement 20 s after ablation in 130°-stage retina. Scale bar = 50 µm. See Video 12. (D–E) Average tissue retraction speed profiles over time are shown for different stages of optic cup folding (represented as angle bins), both at the central (D) or distal (E) positions in the retina. (F–G) Box plot representation of maximal retraction speeds at the different stages, represented as angle bins. For each stage, median values (red bars) and sample sizes are indicated. One-way ANOVA analysis followed by Dunnett’s multiple comparison tests show significant differences (p<0.01**) only at 125–140º-stage. |
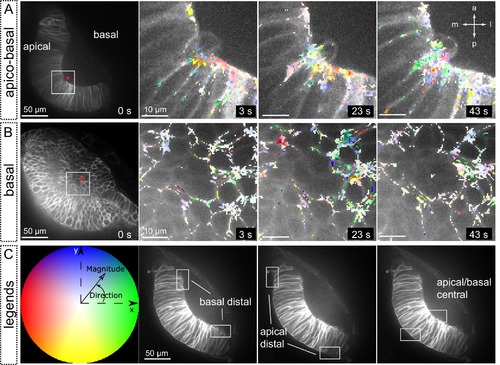
Tissue local relaxation upon laser ablation: Optical flow analysis of tissue displacement. (A–B) Laser ablation experiments at the basal surface of the retina imaged along the apico-basal axis (A) and basal plane (B) Red arrowheads indicate the ablation point. Time 0 corresponds to the first frame after the ablation. Tissue reaction through time is shown at higher magnification (A–B) and particles’ motion is indicated with a color code. (C) Different colors correspond to the direction of the displacement and color intensity to its magnitude. Regions selected for optical flow quantification in Figure 8 are indicated. |
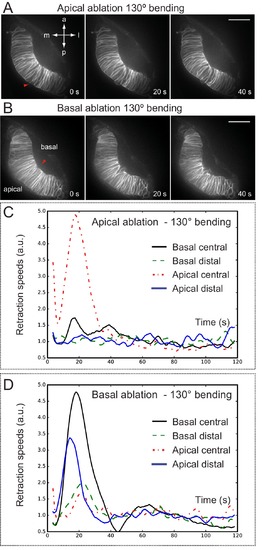
Optical flow analysis of retinal tissue displacement upon apical vs basal laser ablation. (A–B) Laser ablation experiments at the apical (A) or basal (B) surfaces of the retina in wild-type embryos. Red arrowheads indicate the ablation point. Scale bar = 50 µm. (C–D) Tissue retraction speed profiles at different retinal positions (color-coded) are represented for apical (C) vs basal (D) ablations. |
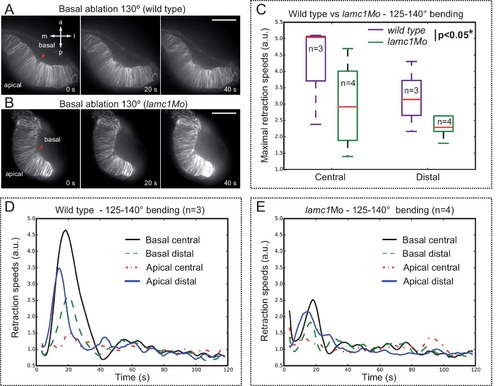
Optical flow analysis of tissue displacement upon laser ablation in wild type vs. lamc1_Mo tissues. (A–B) Laser ablation experiments at the basal surface of the retina in wild type (A) and lamc1Mo (B) tissues. Red arrowheads indicate the ablation point. Scale bar = 50 µm. (C) Box plot representation of maximal retraction speeds for control and morphant tissues both at the central and distal (peripheral) retina. For each stage, median values (red bars) and sample sizes are indicated. Two-way ANOVA analysis shows that retraction speeds are significantly reduced in lamc1 morphants (p<0.05*). (D–E) Tissue retraction speed profiles at different retinal positions (color-coded) are represented over time for wild type (D) and lamc1Mo (E). |