- Title
-
Fgf signalling controls diverse aspects of fin regeneration
- Authors
- Shibata, E., Yokota, Y., Horita, N., Kudo, A., Abe, G., Kawakami, K., Kawakami, A.
- Source
- Full text @ Development
|
The expression of Fgf ligands during zebrafish fin regeneration. (A) RT-PCR analysis of the expression of fgf3, fgf10a, fgf20a and fgf20b at 1, 2, 3 or 4dpa and in uncut fins. The presented data is a part of comprehensive analysis shown in Fig. S1. The number of PCR cycles was 30. actb1, β-actin1 primers. (B) RT-PCR analysis of tissue-specific expression of Fgf genes in the blastema and wound epidermis at 2dpa. The number of PCR cycles was 35. Fgf genes that are mainly expressed in the blastema or wound epidermis are indicated as B (blastema) or E (epidermis) to the right of the panel. (C) Localisation of fgf20a expression in the wound epidermis, as visualised by the enhancer trap line, HGn21A. Enhanced green fluorescent protein (EGFP)-positive cells gave rise to the basal epidermal cells at 2dpa. In the ‘no-regeneration’ state (uncut fin), EGFP was detected in the distal tip of the epidermis. Tissue sections (right panels) were counter-stained with 4′,6-diamidino-2-phenylindole (DAPI). Arrows indicate the site of amputation. Scale bars: 200µm for whole-mount analysis (left panels); 50µm for sections (right panels). (D) Initiation of fgf20a expression in the epidermal cells. A cryostat section of HGn21A regenerate at 12hpa stained with the antibody against p63, a marker of epidermal cells. Scale bar: 50µm. (E) Whole-mount in situ hybridisation (ISH) analysis of fgf3 and fgf10a expression at 4dpa (left panels) and their respective tissue sections (right panels). Expression of these Fgf genes was strongest in the distal region of the blastema, though the region of fgf3 expression was broader than that of fgf10a. Arrowheads mark amputation sites; brackets indicate approximate areas of the blastema. Scale bars: 200µm (left); 50µm (right). |
|
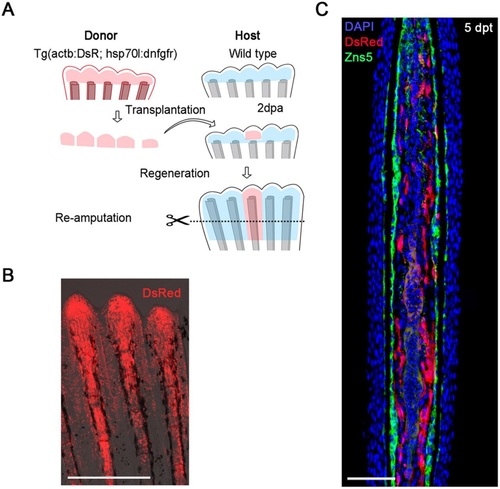
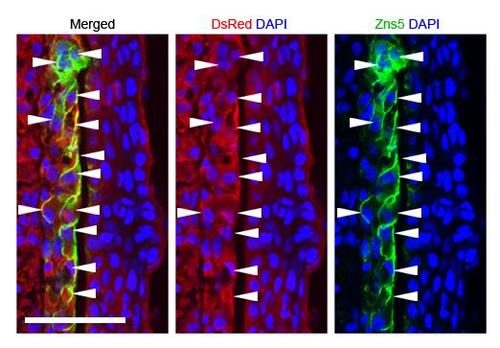
Generation of a mosaic fin by a blastema transplant. (A) The procedure of the blastema transplantation and mosaic analysis. Donor blastema cells were taken from the double-transgenic zebrafish of Tg(hsp70l:dnfgfr1) and Tg(Olactb:loxP-dsR2-loxP-EGFP); the latter transgene drives ubiquitous expression of DsRed2 (Yoshinari et al., 2012). The regenerated fins are a chimera of host cells and transplanted donor cells. (B) A whole-mount fluorescent view of the mosaic fin at 5days post-transplantation (dpt). The fin contains progenies of the transplanted cells expressing the dsRed2. Scale bar: 500µm. (C) A longitudinal tissue section of the mosaic fin at 5dpt stained with an antibody against Zns5, a marker of osteogenic cells (green), and DAPI (blue). The transplanted cells (red) mostly gave rise to mesenchymal cells (11 Zns5-positive cells out of 226 DsRed2-positive cells, counted from 12 sections, from independent transplantations in four different fish). Scale bar: 50µm. |
|
Action of early Fgf signalling on mesenchymal cells induces blastema formation. (A) Tracking of the behaviour of labelled mesenchymal cells from 0 to 2dpa. With intact Fgf signalling, numerous DsRed2-positive mesenchymal cells migrated in the distal direction and contributed to the blastema (HS; 7/7 successful transplants), but few Fgf non-responsive cells participated in blastema formation (+HS; 8/8 successful transplants). Bl, blastema. Dashed lines, site of amputation. The coloured arrowheads respectively indicate the corresponding cell populations between different regeneration stages. (B) Tissue sections of representative samples at 2dpa. In the absence of heat shock (HS), progenies of the transplanted cells contributed to the blastema. By contrast, after heat shock the Fgf non-responsive cells stayed near the amputation plane (+HS). Dotted lines, site of amputation. (C) Quantification of the DsRed2-positive cells in the blastema in the presence (+HS) or absence (HS) of heat shock. n, the number of fin rays that successfully contained many DsRed2-positive mesenchymal cells and were used for quantification (five fish in total, respectively). *P<0.02. (D) Measurement of the length of regenerates of mosaic or non-mosaic fin rays. The heat shock was applied daily, and the lengths of the regenerates were measured at 2dpa. No significant differences were observed in spite of the impaired contribution of Fgf non-responsive cells in the mosaic fin rays. n, the number of fin rays that successfully contained many DsRed2-positive mesenchymal cells and were used for quantification (five fish in total, respectively). (E) Expression of msxc in the mosaic fin. msxc expression was nearly normal at 2dpa in the mosaic regenerate in spite of the reduced contribution of the Fgf non-responsive cells to the blastema (n=5/5 successful transplants). Black and white arrowheads indicate the mosaic fin ray. Dotted lines, site of amputation. (F) Distribution of osteoblasts detected by the anti-Zns5 antibody in the mosaic regenerate at 2dpa. The distribution of osteoblasts was not affected in spite of the impaired contribution of Fgf non-responsive cells in the mosaic fin rays. Dotted line, site of amputation. (G) Quantification of the Zns5-positive cells shown in F. n=the number of sections used for the quantification, which were derived from four independent transplantations. In C,D,G, error bars denote mean±s.e.m.; Student′s t-test was performed to assess statistical significance. n.s., not significant. Scale bars: 200µm (A,E); 50µm (B,F). |
|
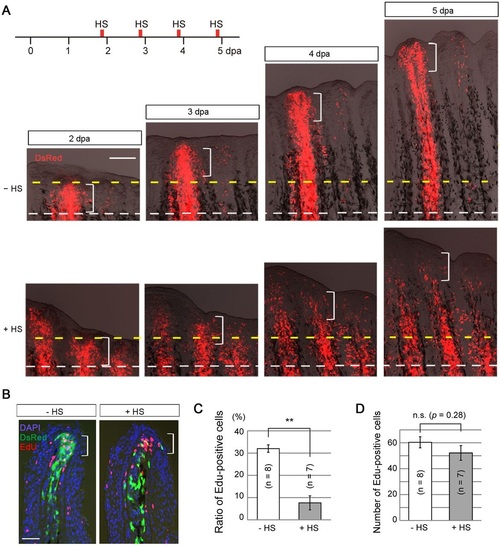
Action of later Fgf signalling on mesenchymal cells is required for cell proliferation. (A) Tracking of the behaviour of labelled cells from 2 to 5dpa. Normally (HS, i.e. normal Fgf signalling), the DsRed2-labelled mesenchymal cells increased in number and contributed to the entire region of a regenerate after 3dpa (n=9/9 successful transplants), whereas Fgf non-responsive mesenchymal cells rapidly retracted from the blastema in the newly regenerated region (+HS; n=8/8 successful transplants). White dashed lines, the site of amputation; yellow dashed lines, the distal end of the blastema at 2dpa and its corresponding sites at subsequent stages; brackets, the approximate area of the blastema (200µm from the distal tip). Scale bar: 200µm. (B) Detection of proliferating cells by EdU labelling at 4dpa. Labelling lasted for 6h before sampling. With intact Fgf signalling (HS), many DsRed2-positive (green) cells were located in the proliferation zone (brackets) and were also positive for EdU. With inhibition of Fgf signalling (+HS), most of DsRed2-positive cells were found outside the proliferation zone and were not showing EdU staining. The tissue sections were counter-stained with DAPI. Scale bar: 20µm. (C) Measurement of the proportion of EdU-positive cells among progenies of the transplanted cells. Approximately 30% of the cells were EdU-positive in the absence of heat shock, but this ratio decreased to 5% by the inhibition of Fgf signalling. n, the number of fin rays that successfully contained many DsRed2-positive mesenchymal cells and were used for quantification (five fish in total, respectively). Error bars represent mean±s.e.m. Student′s t-test was performed to assess statistical significance. **P<0.001. (D) Determination of the total number of EdU-positive cells in the regenerates in C. Overall cell proliferation was not different between the samples with (+HS) and without (HS) heat shock. Error bars represent mean±s.e.m. Student′s t-test was performed to evaluate statistical significance. n.s., not significant. |
|
Fgf20a directs formation of the distal blastema. (A,B) ISH analysis of the distal blastema marker msxc in fgf20a-overexpressing Tg and wild-type (WT) fins at 4dpa. The msxc expression in the fgf20a-overexpressing Tg fins was broader than that in WT fins (n=10/10). (C,D) ISH analysis of junbl, an earlier blastema marker. junbl expression showed striking upregulation in the Tg fins (n=10/10). The colour reaction was terminated at the same time in the Tg and WT fins. Brackets, the approximate area of the blastema (200µm from the distal tip). Scale bars: 200µm (left); 50µm (right). |
|
Expression of fgf3 promotes proliferation of blastema cells. (A) The cell proliferation assay procedure using a blastema explant. (B) EdU incorporation in the blastema explants from Tg overexpressing fgf3 or fgf20a, and wild-type (WT) zebrafish. EdU was applied for 6h before sampling. A significant increase in the number of EdU-positive cells in the fgf3- and fgf20a-overexpressing explants was observed. (C) Quantification of EdU incorporation in the explants. Error bars represent mean±s.e.m. Student′s t-test was performed to assess statistical significance. **P<0.01. n, the number of blastema, which were taken from six WT fish, six Tg(hsp70l:fgf3) or eight Tg(hsp70l:fgf20a). (D) Whole-mount ISH analysis of junbl and fgf3 in fgf20a-expressing and WT explants after 20h at 28.5°C plus 4h at 37.5°C. A significant increase of junbl (n=5/5 explants) or fgf3 (n=5/5 explants) was observed. It is thought that the induction of fgf3 expression by Fgf20a activated cell proliferation. (E) Whole-mount ISH analysis of msxc and junbl in fgf3-expressing and WT fins at 4dpa. Unlike the fgf20a-overexpressing fins (Fig. 5), the fgf3-overexpressing fins did not show an increase in expression of msxc (n=6/6) or junbl (n=6/6). Scale bars: 100µm (B); 200µm (D,E). |
|
The normal pattern of cell proliferation during fin regeneration in zebrafish. (A) Tissue sections of regenerating zebrafish fin in which proliferating cells were detected by the Edu incorporation. EdU labelling lasted for 6 hrs before sampling. For quantitative reproducibility, the 3rd - 5th fin rays from the dorsal or ventral side were used for making sections. “Regenerate” indicates the region distal to amputation plane, and “Proximal non-regenerated region” indicates the region within 100 mm proximal to the amputation plane. Only a few Edu-positive cells were observed at 1 dpa, but the number rapidly increased at 2 dpa both in the regenerating epidermis and mesenchyme. dpa, days post amputation. Scale bar, 100 µm. (B) Quantification of the number of Edu-positive cells in the regenerates that are distal to the amputation plane. Note that the activation of cell proliferation was not detected at 1 dpa in sections of the ray region, which is consistent with previous observations that the epidermal cell proliferation was localised in the inter-ray epidermis (Gauron et al., 2013; Meda et al., 2016). Cell counting was performed on 20 sections (5 sections each from 4 different fish). Error bars represent mean ± s.e.m. Student’s t test was performed to assess statistical significance. **p < 0.001 (C) Quantification of the number of Edu-positive cells in the non-regenerating region (within 100 µm from the amputation plane). Cell proliferation in the proximal region was not changed in the epidermis during the course of regeneration. Cell proliferation in the mesenchyme was rather decreased due to the fin outgrowth and the shift of proliferation zone to the distal place. Error bars represent mean ± s.e.m. Student’s t test was performed to assess statistical significance. n.s., not significant. **p < 0.001 |
|
Recapitulation of fgf20a expression in an enhancer trap zebrafish transgenic (Tg) line, HGn21A. (A) A map of the genomic region where the enhanced green fluorescent protein (EGFP) cassette is inserted in the enhancer trap line HGn21A. The EGFP cassette containing the heat shock protein 70l basal promoter (hsp) and flanking Tol2 sequences was inserted into the site 1.6 kb upstream of fgf20a in zebrafish chromosome 1. Micu3, mitochondrial calcium uptake family member 3. (B) In situ hybridisation (ISH) analysis of fgf20a expression (upper panels) and EGFP expression (lower panels) in HGn21A zebrafish. The corresponding tissue sections, which were prepared after the whole-mount ISH, are shown on the right. Both signals were detected in the basal layer of the wound epidermis (arrows). Arrowheads, the site of amputation. Scale bars, 200 mm for the whole-mount analysis and 50 mm for the tissue sections. (C) EGFP fluorescence at the prim-12 stage in HGn21A zebrafish. Besides the expression in the rhombomere neurons (Terriente et al., 2012), embryonic EGFP expression was detected in tissues such as the heart primordium (arrow) and pectoral fin buds (arrowheads). A dorsal view (left panels) and lateral view (right-hand panels). Arrowheads, the pectoral-fin primordium; arrow, the developing heart; brackets, rhombomere neurons in the hindbrain. Scale bars, 50 µm. |
|
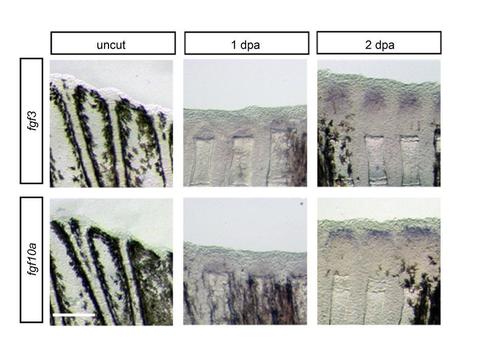
Whole mount ISH analysis for the expression of fgf3 and fgf10a in uncut fin and regenerating fins at 1 dpa and 2 dpa. Signals of fgf3 and fgf10a were firstly detected at 2 dpa, but not at 1 dpa and uncut fin. Scale bar, 200µm. |
|
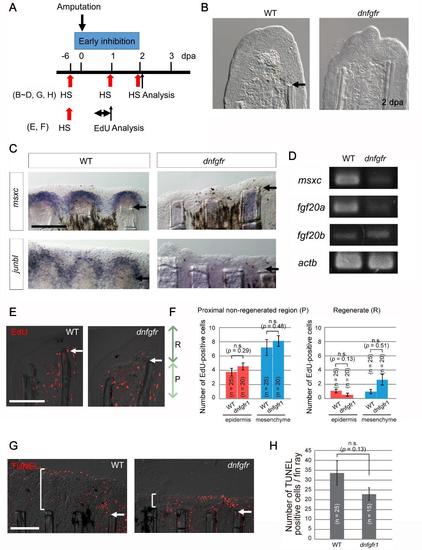
Early inhibition of Fgf signalling impairs blastema formation. (A) The experimental procedure for inhibition of the early Fgf signalling in the Tg(hsp70l:dnfgfr1). (B) Bright-field images of tissue sections of wild-type (WT) and Fgf-inhibited (dnfgfr) fins at 1 dpa. n = 5 of 5, respectively. No blastema formation was evident in the Fgf-inhibited fins. Scale bar, 50 µm. (C) Whole-mount ISH analysis of the blastema markers, msxc and junbl, in WT and Fgf-inhibited fins at 2 dpa. In the Fgf-inhibited fins, the blastema markers failed to be induced. n = 5 of 5 (msxc) and 9 of 9 (junbl). Scale bar, 200 µm. (D) RT-PCR analyses of the expression of msxc, fgf20a, and fgf20b in WT and Fgf-inhibited fins at 2 dpa. After the inhibition of early Fgf signalling, epidermal fgf20a and blastemal msxc were down-regulated, whereas the expression of fgf20b remained stable. The number of PCR cycles was 35. actb, β-actin1. (E) The effect of inhibition of Fgf signalling on cell proliferation at 1 dpa according to an assay of EdU incorporation. EdU labelling was done for 6 hrs before sampling. “R” indicates the regenerate distal to amputation plane, and “P” indicates the non-regenerated region within 100 µm proximal to the amputation plane. Scale bar, 100 µm. (F) Quantification of the EdU-positive cells shown in (E). As in Fig. S1, the 3rd - 5th fin rays from the dorsal or ventral side were used for quantification. n, the total number of sections used for scoring. Four wild-type (WT) and Tg (dnfgfr1) fish were used (5 sections from each fish). No significant difference was observed in the EdU incorporation at 1 dpa by the inhibition of Fgf signalling. Data are presented as mean ± s.e.m. Student’s t test was performed to evaluate statistical significance. n.s., not significant. (G) The effect of inhibition of Fgf signalling on apoptosis. Cellular apoptosis was detected at 2 dpa by the TUNEL staining. Brackets, the region in which the TUNEL-positive cells were counted. (H) Quantification of the number of TUNEL-positive cells per fin ray including the inter-ray region. No significant increase of apoptosis was detected by the inhibition of Fgf signalling. n, the number of fin rays used for quantification, which were derived from 5 WT and 4 dnfgfr1 Tg fish, respectively. n.s., not significant. |
|
The β -actin1 promoter drives DsRed2 expression in osteogenic cells including the osteoblast. A tissue section of a regenerating fin of the Tg(Olactb:loxP-dsR2-loxP-EGFP) (Yoshinari et al., 2012) was stained for osteogenic cells with the anti-Zns5 antibody. Nuclei were counterstained with 4′,6-diamidino-2-phenylindole (DAPI). Scale bar, 50 µm. |
|
The time-lapse analysis of mesenchymal cell migration during the early regeneration stage. Mosaic fins containing the DsRed2-expressing mesenchymal cells (also see Fig. 2) were amputated, and the labelled mesenchymal cells were tracked in every 3 hrs interval between 21 hpa to 48 hpa. Respective coloured arrowheads mark the corresponding cell populations. Scale bar, 200 µm. |
|
An Fgf signal at the stage after blastema formation is required for maintenance of the distal blastema and regenerative cell proliferation. (A) The experimental procedure for inhibition of the later Fgf signalling in the Tg(hsp70l:dnfgfr1). (B) Tissue sections of wild-type (WT) and Fgf-inhibited (dnfgfr) fins that were stained with the anti-Zns5 antibody. The distal Zns5-negative region, which extends approximately 200 µm from the distal tip (bracket), was retracted in the Fgf-inhibited regenerate, representing that blastema is missing. n = 5 of 5, respectively. Nuclei were counterstained with DAPI. Arrows, amputation sites. Scale bar, 50 µm. (C) Whole-mount ISH analysis of the blastema markers msxc and junbl in normal and Fgf-inhibited fins. The blastema markers are severely down-regulated in Fgf-inhibited fins (n = 6 of 6 for msxc and junbl, respectively) as compared to WT fins (n = 6 of 6 for msxc and 7 of 7 for junbl). Scale bar, 200 µm. (D) RT-PCR analysis of the expression of epidermal and blastemal fgf genes in WT and Fgf-inhibited fins. Note that the epidermal fgf20a expression was reduced as well as the blastema fgf3, fgf10a, and msxc. actb1, control PCR with β -actin1 primers. (E) The effect of later inhibition of Fgf signalling on apoptosis at 5 dpa. Cellular apoptosis was detected by the TUNEL staining. Brackets, the regenerate in which the TUNEL-positive cells were counted. Scale bar = 200 µm. (F) Quantification of the number of TUNEL-positive cells. No significant increase of apoptosis was detected by the inhibition of Fgf signalling. n, the number of fin rays used for quantification (5 WT and 4 dnfgfr1 Tg fish, respectively). n.s., not significant. (G) Cell proliferation assessed by EdU incorporation at 4 dpa in WT and Fgf-inhibited fins. EdU labelling lasted for 6 hrs before sampling. “R” indicates the regenerate distal to amputation plane, and “P” indicates the non-regenerated region within 100 µm proximal to the amputation plane. Note that Fgf-inhibition severely reduced the EdU incorporation especially in the blastema. Scale bar, 100 µm. (H) Quantification of the EdU-positive cells shown in (G). As in Fig. S1, the 3rd - 5th fin rays from the dorsal or ventral side were used for making sections. n, the total number of sections used for scoring. Five WT and 5 dnfgfr1 Tg fish were used (5 sections from each fish). Error bars represent mean ± s.e.m. Student’s t test was performed to evaluate statistical significance. n.s., not significant. *p < 0.01. **p < 0.001. |
|
Levels of fgf20a and fgf3 expression in Tg fins overexpressing fgf20a and fgf3, respectively. (A) ISH analysis of fgf20a expression in Tg fins overexpressing fgf20a and wild-type (WT) at 4 dpa. (B) ISH analysis of fgf3 expression in the Tg fins overexpressing fgf3 and WT fins at 4 dpa. All ISH analyses were performed simultaneously under the same conditions including the duration of the colour reaction. n > 5 fins, respectively. Scale bars, 200 µm for the whole mount analysis and 50 µm for the tissue sections. Arrowheads, the site of amputation. |
|
Cell proliferation was not maintained in blastema explants without the wound epidermis. (A) EdU incorporation in blastema explants that were detached from the wound epidermis and incubated in vitro in the L15 medium for 4 hrs (left panel) or 10 hrs (right panel). The Edu labelling was performed for 4 hrs before fixation. Cell proliferation of blastemal explants dramatically decreased within a few hours. Scale bar, 200µm. (B) Quantification of EdU incorporation in the blastema explant. Error bars represent mean ± s.e.m. Student’s t test was performed to assess statistical significance. **p < 0.001. n, the number of blastema, which were taken from 4 fish. (C) Whole-mount ISH analysis of junbl, a distal blastema marker, in blastema explants that were incubated in vitro for 0 hr (n = 5) or 24 hrs (n= 5). The junbl expression rapidly diminished with time and disappeared by 24 hrs. Scale bar, 200 µm. |
|
fgf3 overexpression does not affect cell survival in blastema explant. (A) Cellular apoptosis was detected by TUNEL staining in blastema explant from Tg fins overexpressing fgf3 and sibling wild-type (WT) fins. Scale bar, 100 µm. (B) Quantification of TUNEL-positive cells in the blastema explant. No significant decrease of apoptosis was detected by fgf3 overexpression. n, the number of blastema used for quantification, which were taken from 4 fish. n.s., not significant. |
|
fgf3 overexpression did not affect cell proliferation in uncut fin. (A) EdU incorporation in intact fin from the Tg overexpressing fgf3 and the sibling wild-type (WT) zebrafish. Fish were labelled with EdU for 12 hrs after heat shock. The red colour of fin rays is a non-specific background caused by Edu staining. Scale bar, 200 µm. (B) Quantitative analysis of EdU incorporation in the intact fin. The number of EdU positive cells is divided by the area of fin. The number of EdU-positive cells per unit area is indistinguishable between Tg(hsp70:fgf3) and WT. Error bars represent mean ± s.e.m. Student’s t test was performed to assess statistical significance. n, the number of fish. |


