
- Title
-
Cortisol-treated zebrafish embryos develop into pro-inflammatory adults with aberrant immune gene regulation
- Authors
- Hartig, E.I., Zhu, S., King, B.L., Coffman, J.A.
- Source
- Full text @ Biol. Open
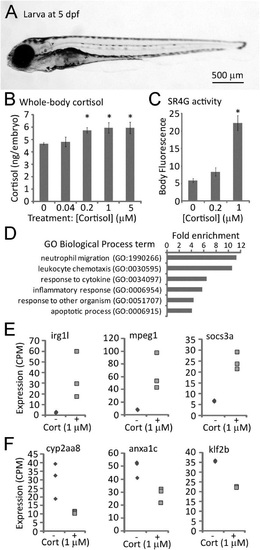
Effects of cortisol treatment on zebrafish larval cortisol levels, glucocorticoid receptor activity and gene expression. (A) Typical larva at 5days post-fertilization (dpf). (B) Whole-body cortisol levels after exposure to varying doses of cortisol from 0-5dpf, measured by ELISA of larval extracts (30 larvae per sample, duplicate measurements of each sample; P=0.015 by one-way ANOVA; * indicates that the difference from untreated controls is statistically significant by post hoc Tukey′s test). (C) GFP fluorescence in the glucocorticoid receptor-responsive reporter line SR4G at 5dpf following treatment with the indicated concentrations of cortisol (20 larvae imaged per sample; P=7.29×10⁻¹¹ by a one way ANOVA; * indicates that the difference from untreated controls is statistically significant by post hoc Tukey′s test). (D) Gene ontology biological process parent terms found by PANTHER to be significantly (P<0.05) overrepresented in the list of genes differentially expressed in 5day old embryos treated with 1µM cortisol. (E) RNA-seq measurements of three genes found to be upregulated in embryos treated (+) with 1µM cortisol, compared to untreated controls (-). (F) RNA-seq measurements of three genes found to be downregulated in 1µM cortisol-treated embryos (+) compared to untreated controls (-). Differences in expression between control and treatment groups shown in E and F are all statistically significant (P<0.05). Error bars in B and C depict standard error of the mean (s.e.m.). |

Effects of early developmental exposure to cortisol on adult tailfin regeneration. (A) Examples of morphologically normal, slightly defective and defective tailfin regeneration. (B) Quantification of combined data on regeneration morphology from three different experimental replicates from a single parental stock. Statistical significance was determined by a Chi-squared test (d.f.=1, comparing the total normal versus the total defective and slightly defective). Subsequent experiments using a newly imported parental stock did not show any overt morphological defects (possibly owing to the high polymorphism of the wild-type AB strain); however they did manifest the effects shown in panels C-F. (C) Quantification of neutrophils and macrophages in regenerating fin tissue (dpa, days post-amputation), respectively measured by fluorescence intensity of fins from mpx:GFP and mpeg1:YFP transgenic fish derived from untreated control embryos (-) or embryos treated with 1µM cortisol (+). In one experiment counts of individual cells at a single time point confirmed that the differences in fluorescence intensity reflect differences in cell number. The bars represent the grand means±s.e.m. of measurements from three experimental replicates of the neutrophil counts, and two experimental replicates of the macrophage counts (a third macrophage experiment which did not show significant differences was not included, as it did not include the same time points). For the neutrophils the number of fish in each replicate ranged from 9-18, with overall totals of 41 control and 37 treated. For the macrophages the number of fish in each replicate ranged from 9-11, with overall totals of 21 control and 18 treated. Statistical significance **P=0.0017; *P=0.01; †P=0.028; ‡P=0.0226, by a two tailed t-test. (D) Scatter plots of average expression level and fold-change in expression for each gene in tailfin regenerates at 2dpa compared to 0dpa in 4.5-month-old control (untreated) fish and fish derived from cortisol-treated embryos. The red dots indicate genes with significant differential expression (P<0.05), the numbers of which (over- and under-expressed) are also shown in red. (E) Scatter plot of average expression level and fold-change in expression, showing interaction of cortisol treatment and time (0-2dpa). Red dots indicate genes with significant differential expression (P<0.05), the numbers of which (over- and under-expressed) are also shown in red. (F) RNA-seq time course measurements of seven of the most significantly differentially expressed genes from the analysis shown in E; lines show the averages of three biological replicates, each of which are indicated by individual data points for both cortisol treatment (+, light gray) and untreated control (-, dark gray) groups. (G) qRT-PCR time course measurements of four of the genes shown in (F), during tailfin regeneration in 10month old adults from the same cohort shown in D-F. PHENOTYPE:
|
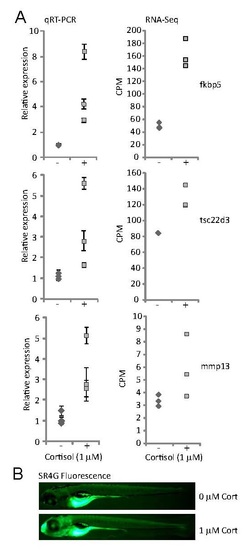
Cortisol treated larvae have higher levels of Glucocorticoid Receptor activity. (A) Expression of known glucocorticoid-responsive genes fkbp5, tsc22d3, and mmp13 measured by qRT-PCR and RNASeq untreated control larvae (-) and larvae treated with 1 µM cortisol (+) from 0-5 days post-fertilization. Individual data points represent measurements from one of three biological replicates. Error bars represent standard deviation of three technical replicates for each measurement. Differences in average expression between control and treatment groups are all statistically significant (p < 0.05). (B) Fluorescence in untreated and cortisol-treated SR4G larvae. The bright fluorescence in the yolk sac is autofluorescence, which was excluded from the measurements shown in Fig. 1C. |
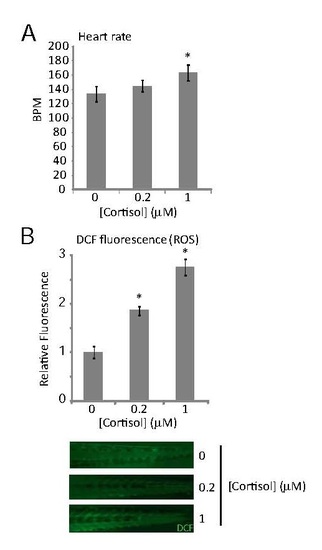
Effects of treating zebrafish embryos with the indicated doses of cortisol from fertilization up to 5 days post-fertilization (dpf) on (A) average heart rate at 3 dpf (20 larvae per sample; p = 1.54 x 10⁻¹² by one-way ANOVA; * indicates that the difference from untreated controls is statistically significant by post-hoc Tukey’s test); and (B) reactive oxygen species levels in tail muscle, measured by backgroundcorrected DCF fluorescence at 5 dpf (5 larvae imaged per sample, in two biological replicates; p = 5.43 x 10⁻⁶ by one-way ANOVA; * indicates that the difference from untreated controls is statistically significant by post-hoc Tukey’s test). Error bars represent SEM. Example images are shown beneath the graph. |

Effect of cortisol treatment on whole body fluorescence in larvae of a NF-κB-responsive GFP reporter line (20 larvae imaged per sample; *p = 0.035 b y a two-tailed t-test). |