
- Title
-
Rx3 and Shh direct anisotropic growth and specification in the zebrafish tuberal/anterior hypothalamus
- Authors
- Muthu, V., Eachus, H., Ellis, P., Brown, S., Placzek, M.
- Source
- Full text @ Development

rx3 expression around the third ventricle. (A) Schematic of 55hpf forebrain indicating subdivisions of hypothalamus relative to the rostro-caudal axis and adenohypophysis (blue oval). Green and black show shh (Fig. 3) and rx3 expression. Dots depict rostro-caudal position of AR (blue) and PR (red) next to zone III (purple). (B-B′′) Whole-mount 55hpf embryo after rx3 in situ hybridization. In B, lines show planes of section shown in C-F. In B′,B′′ side and ventral views are aligned (white lines) and show position of rx3 relative to morphological landmarks (oc, optic commissure; PO, preoptic hypothalamus). (C-F′) Representative serial sections through a single embryo: bottom panels show high-power views of boxed regions. Red arrowheads point to zone III neuroepithelial-like cells; black arrowheads point to rx3- cells in AR tips. (G-I) Whole-mount side view of 30hpf embryo after rx3 in situ hybridization; lines in G′ show planes of sections shown in H,I. Dotted lines in C′-F′,H,I delineate outline of ventral hypothalamus, and in G,G′ delineate DTJ. zli, zona limitans intrathalamica. Scale bars: 50µm. |
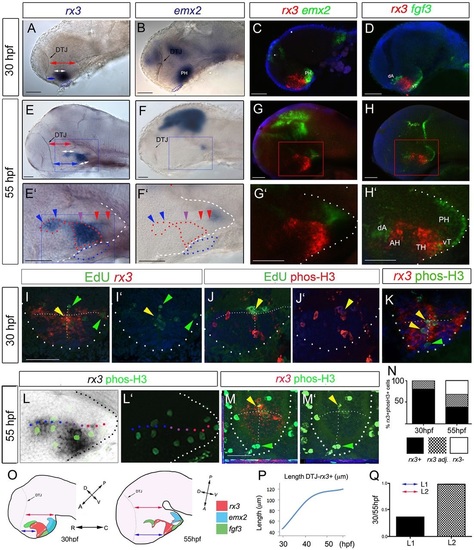
Anterior/tuberal hypothalamus elongates from rx3+ progenitors. (A-H′) Side views after single or double FISH at 30hpf (A-D) and 55hpf (E-H; E′-H′ show high-power views of boxed regions). Arrows in A,C,E,G show distances measured for growth comparisons. Arrowheads in E′,F′ indicate position of recesses (colour-coded as in Fig. 1A). (I-K) Maximum intensity projections of representative sections through 30hpf embryos. I,J show serial adjacent sections; I′,J′ show single-channel views. Arrowheads show co-labelled (yellow) or single-labelled (green) cells. T-shaped white dotted lines indicate outline of AR and LR. (L,L′) Side views of 55hpf embryo; L′ shows single-channel view. (M,M′) Representative single-plane views taken through zone II; M′ shows single-channel view. Yellow arrowheads show double-labelled cells; green arrowheads point to phosH3+ rx3- cells at recess tips. (N) Quantitative analyses of cycling cells at 30-55hpf as indicated by phosH3 expression in rx3+ cells, rx3- cells or in cells adjacent (adj.) to rx3+ cells. (O) Schematic depicting rx3, fgf3 and emx2 expression, and change in length and axial orientation of hypothalamus. A ‘bending’ of the tuberal/anterior hypothalamus occurs over 30-55hpf, relative to the rostro-caudal axis. Red arrows indicate length of dorsal diencephalon or length of emx2+ PH; white arrows indicate length of rx3+ territories; blue arrows indicate distance from DTJ to rx3+ zone III. (P) Length from DTJ to rostral tip of rx3+ zone III (n=5 embryos each at 30, 40, 48, 55hpf). (Q) Tuberal/anterior hypothalamus grows approx. 2.5-fold more than dorsal diencephalon, emx2+ PH or ventral rx3+ zone III (n=10 each; P<0.0001). Dotted and dashed lines delineate ventral hypothalamus and T-shaped AR/LR (white), adenohypophysis (blue) and rx3-expressing domain (red). AH, anterior hypothalamus; dA, dorso-anterior; PH, posterior hypothalamus; TH; tuberal hypothalamus; vT, ventral tuberal. Scale bars: 50µm. |

Differentiation in the 30-55hpf anterior/tuberal hypothalamus. (A-N) Side views (A,B,D,E,G-J,L-N), ventral views (C,F), sagittal (K) or transverse (K′′,M′′) sections of 30hpf and 55hpf embryos. A′,M′ show high-power views of boxed regions. In B′,E′,F, white arrowheads point to shh(weak+) AR cells; in H′, to otpb+ cells in the tuberal/anterior hypothalamus; in M′,N, to hypothalamic pomc+ cells. In D′,E′, arrowheads point to rx3+shh+ cells (yellow), rx3+ cells (red) or shh+ cells (green). (O,P) Schematics depicting expression domains at 30hpf (O) or 55hpf (P). AH, anterior hypothalamus; PH, posterior hypothalamus; PO, preoptic hypothalamus; TH; tuberal hypothalamus. Scale bars: 50µm. |
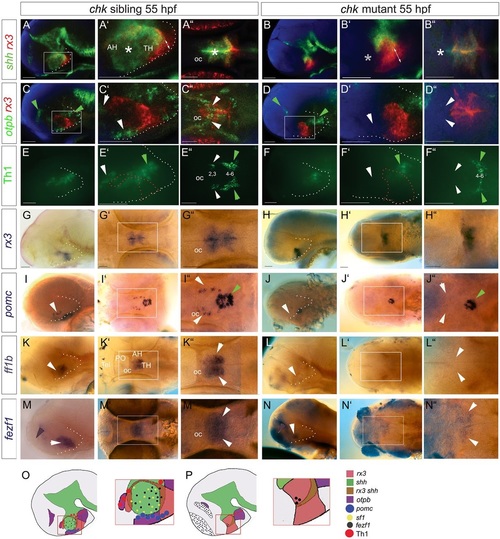
Rx3 is required for shh+ AR and anterior/tuberal differentiation. (A-N) Side or ventral views of 55hpf chk sibling or mutant embryos. Asterisks in A′,A′′ show shh+ AR, which is absent in the chk mutant (B′B′′, asterisks). White arrowheads point to otpb+ tuberal/anterior cells (C′,C′′), Group2/3 Th1+ anterior cells (E′,E′′), pomc+ cells (I,I′′), ff1b+ cells (K,K′′), all of which are absent in chk mutants (D′,D′′,F′,F′′,J,J′′,L,L′′,N,N′′), and to fezf1+ progenitors (M,M′′), which are reduced in the chk mutant (N,N′′). Green arrowheads point to expression domains unaffected in chk mutants. Purple arrowheads point to fezf1 domain, upregulated in chk mutants. White and red dotted lines as in Fig. 2. (O,P) Schematics depicting expression patterns; boxed regions show areas shown in high-power views. AH, anterior hypothalamus; oc, optic commissure; PO, preoptic hypothalamus; Tel, telencephalon; TH; tuberal hypothalamus. Scale bars: 50µm. |

Rx3 suppresses dorsal and ventro-tuberal progenitors. (A-I) Side views of control embryos or embryos in which rx3 is absent. A′,B′,F′ show high-power views of boxed regions in A,B,F. Blue arrowheads and red arrows in A-D point to nkx2.1+ cells, which are absent in chk mutants. Blue arrows in C,D point to nkx2.1+ ventral-tuberal domain. Red arrowheads in F point to ectopic pax6+ cells. Black dotted lines indicate outline of ventral hypothalamus. Red dotted lines as in Fig. 2. Purple arrowhead in G′ points to rx3+pea3+ cells. H,I show views of isolated neuroectoderm. (J,K) Schematics of expression patterns in chk sibling (J) or mutant (K) 55hpf embryos. White and red dotted lines as in Fig. 2 AH, anterior hypothalamus; PH, posterior hypothalamus; PT, posterior tuberculum; Tel, telencephalon; (c)(r)Tub, (caudal) (rostral) tuberal hypothalamus. Scale bars: 50µm. |

Rx3 promotes progenitor survival and growth. (A-C,G-I) Whole-mount side views (A,G) or sections (B,C,H,I: planes and positions indicated by coloured asterisks) through 55hpf control or rx3 morphant embryos. A′,G′ show high-power views of boxed regions in A,G. Arrowheads in I show disorganized shh+ cells around 3V. (D,J) Whole-mount side views of phosH3 in 55hpf control or rx3 morphant embryo. (E,E′,K,K′) Representative sections after phosH3/rx3 co-labelling in 55hpf chk sibling or mutant embryos. E′,K′ show single-channel views. (F,L) Quantitative analyses. (F) Numbers of phosH3+ cells in chk mutant or sibling embryos (n=6 each). Significantly more phosH3+ cells are detected in mutants compared with siblings (P<0.001). (L) Proportion of phosH3+ cells that are rx3+ (black), adjacent to (hatched) or distant from (white) rx3+ cells in mutant versus sibling chk embryos. (M-R,T-Y) Representative serial sections, from rostral to caudal (coloured asterisks denote approximate position of each section, see A′,G′) of a 55hpf chk sibling (M-R) or mutant (T-Y) embryo. White arrowheads point to EdU+ cells. (S,Z) Representative sections of 35hpf chk sibling or mutant embryos. 18±2 cCasp+ cells detected in chk mutants, n=8 embryos. Schematics summarize expression patterns in mutant versus sibling chk embryos. White and blue dotted lines as in Fig. 2. Scale bars: 50µm. |
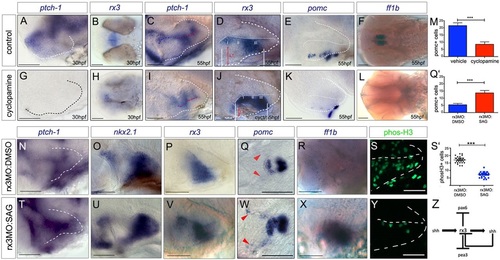
Shh signalling functions as an rx3 ‘on-off’ switch. (A-L) Side or ventral views of 30hpf and 55hpf wild-type embryos, exposed to vehicle or cyclopamine over 10-28hpf (A,B,G,H) or over 28-55hpf (C-F,I-L). Red arrows and white bars in D,J show distances measured for width and length of tuberal/anterior hypothalamus. (M) Quantitative analysis: significantly fewer pomc+ cells are detected after cyclopamine exposure (***P<0.0001, n=30 embryos). (N-Y) Side or ventral views of 55hpf rx3 morphant embryos, exposed to DMSO vehicle (N-S) or SAG (T-Y) from 28hpf. (Q′,S′) Quantitative analysis. Significantly more pomc+ cells (Q′; ***P<0.0001, n=30 embryos) and significantly fewer phosH3+ cells (S′; ***P<0.0001, n=27 embryos) are detected after late SAG rescue. (Z) Model for anterior/tuberal progenitor development. Scale bars: 50µm. |

Loss of AR and disorganization of lateral recess in rx3 morphant. (A-C) Transverse sections (A,C) through 55hpf control embryos, at planes shown in (B) after in situ hybridization with shh/sf1 (A) or rx3 (C). (A′) shows high-power views of boxed regions in (A). AR cells are shh+rx3- (red arrowheads in A′,C). (D) Transverse sections at equivalent positions in rx3 morphant embryos: the shh+ AR fails to form (D,D′, left hand panels), shh+ progenitors accumulate abnormally in/around the 3rd ventricle (middle panels). In more posterior regions of the neuraxis, shh appears normal (right hand panel). Scale bars: 50µm. |
Zones 1-III do not resolve in rx3-null embryos. Wholemount side or ventral views of 55hpf control (A.B) or morphant (C,D) embryos after in situ hybridization to detect rx3. Side and ventral views are aligned. Zones 1, II and III, readily distinguished in control embryos (white lines), cannot be resolved in morphant embryos. At the same time, the normal flexure of the hypothalamus is not detected in morphants (red dotted line and angle in (A) and (C) |

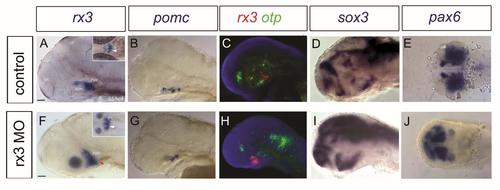
rx3 morphant embryos phenocopy ckh mutants. Side views (A-D, F-I) or ventral views (E,J, inset in A,F) of control-injected or rx3-morpholino-injected embryos at 55hpf analysed by single in situ hybridization or double FISH. Abbreviations: ADH, anterodorsal hypothalamus; OT, optic tectum; PVH, posterior ventral hypothalamus; Tel, telencephalon. Scale bars: 50µm. |

dorsal and ventro-tuberal progenitors expand in absence of rx3. Side views (A-F) or transverse sections (G,H) of 55hpf ckh sibling or mutant embryos. White arrowheads in (A,B) point to ascl1- sox3- domains, not present in ckh mutants (C,D). Red arrowheads in (B) point to ectopic ascl1+ domains in the anterior hypothalamus, ventral tuberal hypothalamus and telencephalon. Red arrows in (A,B) indicate rostro-caudal length of ventro-tuberal hypothalamus. White arrowheads in (E,F) point to fgf3+ cells in ventro-tuberal hypothalamus. (I,J) Schematics of chk sibling (I) or mutant (J): boxed regions show areas shown in high power views. Scale bars: 50µm. |

shh induces rx3. (A,B) Wholemount views at 70% epiboly. rx3 is expressed in a broad crescent in anterior-most regions of the CNS. shh is expressed in ventral midline (vm) cells of the neural tube and in axial mesoderm. (B′) transverse section at the level of the prechordal plate (p.p), plane shown in (B). (C,D) Ventral views after rx3 wholemount in situ hybridization: rx3 expression is abolished in smu mutants (red arrowheads). (E,F) Number of tyroxine hydroxylase (th)-expressing cells in posterior hypothalamus is unchanged after cyclopamine treatment. Scale bars: 50µm. |

Late Shh rescue requires rx3 function. Sagittal sections taken through rx3 morphant embryos (A) or chk mutant embryos (B) after exposure to SAG over 28-55hpf.rx3, shh and pomc are rescues in morphant embryos, but not in chk mutants. Scale bar: 50µm. |