
- Title
-
Embryonic hematopoiesis in vertebrate somites gives rise to definitive hematopoietic stem cells
- Authors
- Qiu, J., Fan, X., Wang, Y., Jin, H., Song, Y., Han, Y., Huang, S., Meng, Y., Tang, F., Meng, A.
- Source
- Full text @ J. Mol. Cell Biol.
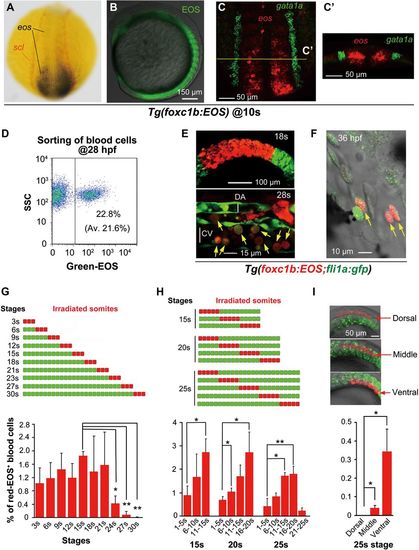
Stage- and position-dependent hematogenic activity of somites. (A) Double in situ hybridization patterns of scl (red) and eos (black/blue) in a dorsally viewed Tg(foxc1b:EOS) embryo at the 10s stage. (B) EOS protein fluorescence in somites and paraxial mesoderm in a laterally viewed Tg(foxc1b:EOS) embryo at the 10s stage. (C and C′) Double fluorescence in situ hybridization patterns of eos (red) and gata1a (green) in a Tg(foxc1b:EOS) embryo at the 10s stage. The confocal image of trunk region was dorsally viewed (C) with an optical cross section showed in C′. (D) A representative FACS result of green-EOS+ blood cells from 10 Tg(foxc1b:EOS) embryos. The average from three independent experiments was shown in parenthesis. (E and F) green-EOS in five pairs of somites in Tg(foxc1b:EOS;fli1a:gfp) embryos was converted to red-EOS by irradiation at the 18s stage (top) and the resulted red-EOS+ cells (indicated by arrows) were found in the ICM at the 28s stage (bottom) (E) and in the heart (F). DA and CV represent the forming dorsal aorta and cardinal vein. (G-I) In Tg(foxc1b:EOS) embryos, three nascent somites at different stages (G), a group of 5 somites along the anteroposterior axis at different stages (H), or different portions of five nascent somites along the dorsoventral axis (I) were irradiated (top) and red-EOS+ blood cells were analyzed by flow cytometry at 30-36 hpf. Data were averaged from three independent experiments with 5-10 embryos each. Statistical significance: *P < 0.05; **P < 0.01. EXPRESSION / LABELING:
|
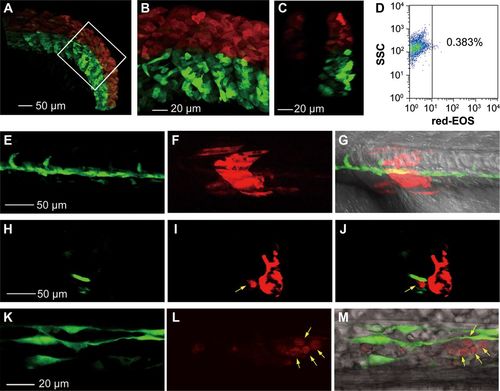
Photoconverted hematopoietic cells are derived from somites but not LPM-derived blood precursors. (A-D) Dorsal somitic cells have a certain hematogenic activity at the 15s stage. The dorsal portion (above the notochord) of all somites in Tg(foxc1b:EOS) embryos was irradiated to avoid flashing the LPM-derived hematopoietic precursors. The posterior trunk region was shown (A) with the boxed area enlarged (B) and an optical cross section shown in C. The blood cells taken from 10 irradiated embryos in group at 30 hpf were analyzed by flow cytometry for red-EOS+ cells (D). (E-M) A downward irradiated single somite generates hematopoietic cells. The eighth somite on one side of a Tg(foxc1b:EOS;fli1a:gfp) embryo at the 20s stage was irradiated from the dorsal downward and the embryo was observed laterally (anterior to the left) by confocal microscopy at the 28s stage. (E-G) Trunk region focusing on the notochord. (H-J) An optical cross section from (E to G) with a photoconverted blood cell (indicated by an arrow) within the vessel. (K-M) An enlarged ICM region. Photoconverted blood cells were indicated by arrows. EXPRESSION / LABELING:
|

Somite hematopoiesis is unaffected in embryos lacking primitive hematopoietic cells. (A-C) Somite-derived blood cells existed in clo mutants. (A) Confocal microscopic observation of somite-derived blood cells in a segment of the ICM in Tg(foxc1b:EOS;gata1a:DsRed);clo mutant and sibling. (B and C) Flow cytometry revealed that the number of DsRed+ cells in clo mutants was significantly reduced (B) whereas the number of EOS+;DsRed+ blood cells was not changed (C). The cell number per embryo for each type was averaged from 10 embryos. **P < 0.01; ns, non-significance (P > 0.05). (D and F) The number of gata1a+ primitive hematopoietic cells was significantly reduced in Tg(gata1a:DsRed) cdx4 morphants as indicated by confocal observation (D) and flow cytometry (F). (D) The ratio of embryos with the representative pattern was indicated. (F) Circulating blood cells taken from a pool of five embryos at 30 hpf were sorted by flow cytometry and the number of DsRed+ blood cells per embryo was calculated. *P < 0.05. The average was based on three independent experiments. (E, G, and H) The generation of somite-derived Red-EOS+ blood cells was unaffected in cdx4 morphants. Tg(foxc1b:EOS;fli1a:gfp) (B), or Tg(foxc1b:EOS) (D and E) embryos were injected with cMO or cdx4-MO at the one-cell stage. Five pairs of nascent somites of the injected embryos were photoactivated at the 20s stage, followed by confocal observation of Red-EOS+ cells (indicated by arrows) in the ICM at the 28s stage (E) and in the heart at 36 hpf (H) and by sorting of Red-EOS+ blood cells (F and G). ns, statistically non-significance (P > 0.05). EXPRESSION / LABELING:
PHENOTYPE:
|

Vasculature imperfection has no impact on hematopoiesis. (A and B) Effect of etv2 knockdown on vasculature formation. Note that etv2 morphants had normal morphology but lacked both dorsal aorta and cardinal vein in the trunk region. The ratio of embryos with the representative pattern was indicated. cMO, control morpholino. (C) foxc1b:EOS;gata1a:DsRed double-positive cells in the ICM of etv2 morphant or control at the 28s stage. (D and E) Sorting results of gata1a:DsRed+ (D) and fox1b:EOS+;gata1a:DsRed+ blood cells (E) in etv2 and control morphants at 30 hpf. The fluorescent cell number per embryo was averaged from three independent experiments (10 embryos each). *P < 0.05; ns, non-significance (P > 0.05). (F) kdrl knockdown impaired growth of intersegmental vessels (indicated by arrows). The ratio of affected embryos was indicated. (G and H) Effect of kdrl knockdown on LPM hematopoiesis (G) and somite hematopoiesis (H). For the injected Tg(foxc1b:EOS) embryos, five pairs of new born somites were photoactivated at the 20s stage. All embryonic cells were collected from a group of five embryos at 30 hpf and were sorted by flow cytometry for DsRed+ (G) or red-EOS+ cells (H). The number of cells with expected fluorescence per embryo was averaged from three independent experiments. ns, non-significance (P > 0.05). EXPRESSION / LABELING:
PHENOTYPE:
|

Analysis of sHPSCs in larvae and adults. (A) Co-colonization of foxc1+ sHPSCs (indicated by arrows) with cmyb+ HSCs in the kidney of a Tg(foxc1b:EOS;cmyb:gfp) transgenic larva, which was photoactivated in five pairs of posterior somites at the 25s stage. gb, gall bladder with red autofluorescence. (B) Detection of sPHSCs by flow cytometry in adult (3–6 months old) kidney marrow of various transgenic lines. The representative result was shown for one fish, and the average ratio (Av.) of EOS+ or GFP+ sHPSCs from three fish was indicated in parenthesis. (C) EOS+ or GFP+ sHPSCs sorted from the adult kidney marrow of a representative fish in various transgenic lines were re-analyzed by forward and side scatter. Different scatter fractions were circled with indicated percentage of cells. The yellowed area represented the sorting result of the WKM. The average percentage from three analyzed fish was written in red. (D) Expression levels of a set of muscle/skeletal or hematopoietic marker genes in twist1a+ or fmyhc2+ sHPSCs were analyzed by qRT-PCR compared to cmyb+ hematopoietic cells. GFP+ cells were sorted from the kidney marrow of corresponding transgenic adult fish. Data were shown as means from three experiments with the error bar indicated. *P < 0.05; **P < 0.01. EXPRESSION / LABELING:
|
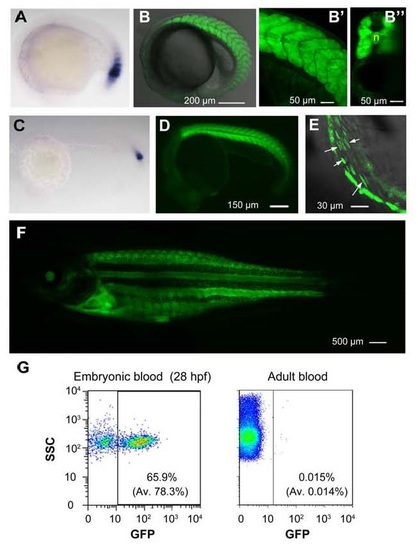
GFP expression pattern in Tg(ripply1:gfp) transgenic line. (A and C) Detection of ripply1 expression in nascent somites of wild-type embryos at 22s stage (A) and at 24 hpf (C) by in situ hybridization. (B-B′′) Confocal image of GFP expression in somites of a Tg(ripply1:gfp) embryo at 22s stage (B). The enlarged trunk region (B′) and an optical cross section (B′′) were shown. n, notochord. (D) GFP expression in transgenic embryos at 24 hpf. (E) GFP+ circulating hematopoietic cells (indicated by arrows) in the heart were observed by confocal microscopy at 36 hpf. See also Movie S1. (F) GFP was still expressed in adult fish. (G) Flow cytometry results showing the existence of GFP+ blood cells in the embryonic circulation at 28 hpf (left) and in the circulation of adults (right). Embryonic blood cells were sucked from the hearts of 5-10 embryos at 28 hpf. Adult blood cells were taken from the heart. The showed were representative results with average (Av) from 3 independent experiments in parenthesis. EXPRESSION / LABELING:
|

GFP expression pattern in Tg(rbfox1l:gfp) transgenic line. (A) Confocal image showing GFP expression in somites of a Tg(rbfox1l:gfp) transgenic embryo at 22s stage. (B) The expression pattern of endogenous rbfox1l in wild-type embryo at 28 hpf, revealed by in situ hybridization. (C-C′′) GFP expression in somites of a transgenic embryo at 28 hpf (C). The enlarged trunk region (C′) and an optical cross section (C′′) were shown. (D) GFP+ circulating hematopoietic cells (indicated by an arrow) in the heart were observed by confocal microscopy at 36 hpf. (E) Flow cytometry result showing the existence of GFP+ blood cells in the embryonic circulation. Embryonic blood cells were sucked from the hearts of 5-10 embryos. A representative result was shown with the average (Av) from 3 independent experiments in parenthesis. EXPRESSION / LABELING:
|
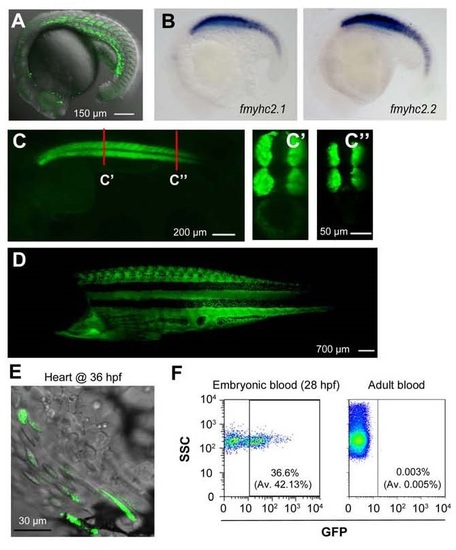
GFP expression pattern in Tg(fmyhc2:gfp) transgenic line. In this line, the Tol2-based enhancer trap element was inserted in between the fast muscle heavy chain genes fmyhc2.1/myhz2 and fmyhc2.2/myhc4. (A) GFP expression in somites of a transgenic embryo at 22s stage. (B) Endogenous fmyhc2.1 and fmhc2.2 genes share a similar expression pattern in 22s wild-type embryos. (C-C′′) GFP expression pattern in a 28-hpf embryo with two optical cross sections (C′, C′′) at indicated positions. Note that GFP expression was restricted to somites. (D) GFP expression in adult fish (laterally positioned). (E) Some GFP+ hematopoietic cells were circulating through the heart in an embryo at 36 hpf. See also Movie S2. (F) Flow cytometry results showing the existence of GFP+ blood cells in the embryonic circulation (left) and in the circulation of adults (right). Embryonic blood cells were sucked from the hearts of 5-10 embryos at 28 hpf. Adult blood cells were taken from the heart. The showed were representative results with average (Av) from 3 independent experiments in parenthesis. EXPRESSION / LABELING:
|
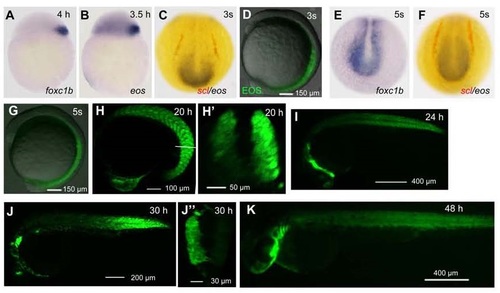
EOS expression pattern in Tg(foxc1b:EOS) transgenic line. This line was identified from the founder fish that was injected with the Tol2(foxc1b:EOS) construct at the one-cell stage. The expression of EOS was driven by a 3.6-kb promoter of the foxc1b gene. (A, B, E) Expression patterns of foxc1b mRNA in wild-type embryos (A and E) and eos mRNA in Tg(foxc1b:EOS) embryo (C and F). The expression of scl (red) and eos mRNAs (black/blue) was detected by double in situ hybridization. The posterior part of the embryos in (C, E and F) was dorsally viewed. The stages were indicated. (D and G-K) Confocal images showing EOS expression in transgenic embryos at indicated stages. Embryos were laterally viewed. (H′) An optical cross section at the position indicated in (H). (J′) An optical cross section was reconstituted from the posterior trunk region of the embryo shown in (J). |

Emigration of an EOS-positive cell from the ventral domain of the somite in Tg(foxc1b:EOS) transgenic embryo. The embryo was laterally orientated and observed continuously from 22 to 30 hpf with focus on posterior somites by confocal microscopy. The imaging time points were indicated. An emigrating cell was indicated by arrows. See also Movie S3. Note that the embryo looked younger because its posterior trunk could not extend well when it was embedded in agarose gel. Beside, the tracked cell was vanished in the last frame most likely because it had flowed away with the circulation. |
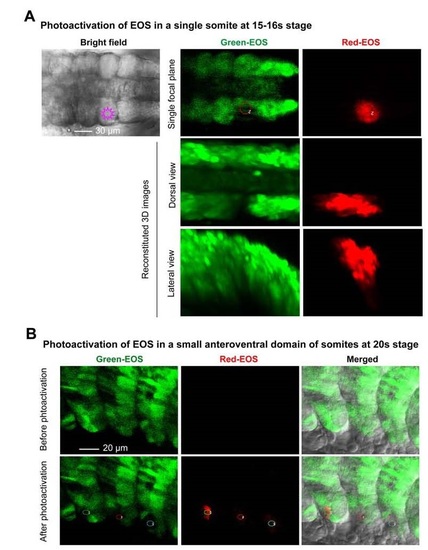
Photoactivation of the reporter EOS in defined embryonic locations. Tg(foxc1b:EOS) transgenic embryos were used throughout. (A) Photoactivation of a single somite at 15-16s stages. The irradiated somite on one side was marked in the left bright-field image (dorsal view). The green EOS in the exposed area started to emit red fluorescence immediately after irradiation (right panel). The embryo was orientated with anterior to the left. Note that fluorescent cells in between the paraxial mesoderm (in the middle panel) should be emigrating somitic cells, either sclerotomal or transdifferentiating hematopoietic cells. (B) A small anteroventral region of three consecutive somites of an embryo at 20s stage was irradiated and red fluorescence was detected by confocal microscopy immediately. |

Cells of somite origin transform into hematopoietic cells, endothelial cells or pericytes. Tg(foxc1b:EOS;fli1a:gfp) double transgenic embryos were used. (A) Four pairs of somites in the middle trunk of an embryo at 15s stage were irradiated by laser and imaged immediately by confocal microscopy (lateral view). (B) The trunk ventral region of the photoactivated embryo was observed by confocal microscopy at 28s stage. The embryo was orientated with anterior to the left. The red-EOS+;GFP+ blood cells and endothelial cells were indicated by white and yellow arrowheads respectively, and a red-EOS+ cell of unknown identity was indicated by a blue arrowhead. |
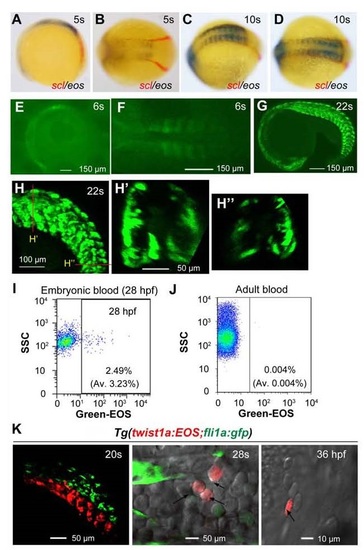
EOS expression pattern in Tg(twist1a:gfp) transgenic line. This line was identified from the founder fish that was injected with the Tol2(twist1a:EOS) construct at the one-cell stage. The expression of EOS was driven by a 4.9-kb promoter of the twist1a gene. (A-D) The expression of scl (red) and eos (black/blue) mRNAs in the transgenic embryos at indicated stages, as detected by double in situ hybridization. The embryos were orientated with anterior to the right and viewed either laterally (A) or dorsally (B-D). (E-H′′) The fluorescence of EOS protein in the transgenic embryo at indicated stages. (E and F) Weak EOS expression was observed by confocal microscopy in a transgenic embryo at 6s stage. The embryo was laterally (E) or dorsally (F) viewed with anterior to the left. (G) EOS was expressed in the migrating sclerotomal cells in a 22s embryo. (H-H′′) A trunk region of the embryo shown in (G) was enlarged (H) and two optical cross sections at indicated positions were shown in (H′ and H′′). (I) The proportion of EOS+-blood cells in the circulation of Tg(twist1a:EOS) embryonic hearts at 28 hpf was analyzed by flow cytometry. The average (Av) was the mean of three independent experiments, each including 5-10 embryos. The showed was the representative result of one experiment. (J) Green-EOS+ cells in the circulation of Tg(twist1a:EOS) transgenic adult was analyzed by flow cytometry. The showed was the representative result from a single fish with the average from three fish in parenthesis. (K) Photoconverted red-EOS+ sclerotomal cells gave rise to hematopoietic cells. The ventral region of posterior somites of Tg(twist1a:EOS;fli1a:gfp) embryos at 20s stage was photoconverted (left) and red-EOS+ (indicated by arrows) was found in the ICM at 28s stage (middle) and in the heart at 36 hpf. EXPRESSION / LABELING:
|

GFP expression pattern in Tg(pax1a:gfp) transgenic line. This line was identified from the founder fish that was injected with the Tol2(pax1a:gfp) construct at the one-cell stage. The expression of GFP was driven by a 2.4-kb promoter of the pax1a gene. (A, E and I) in situ hybridization indicated the expression of endogenous pax1a in the sclerotome of wild-type embryos at 24 hpf (A), 30 hpf (E) and 48 hpf (I). (B-D) GFP expression in transgenic embryos at 24 hpf. A trunk region (C) and an optical cross section (D) of the same embryo (B) were shown. n, notochord. (F-H) GFP expression in transgenic embryos at 30 hpf. A trunk region (G) and an optical cross section (H) of the same embryo (F) were shown. (J-L) GFP expression in transgenic embryos at 48 hpf. A trunk region (K) and an optical cross section (L) of the same embryo (J) were shown. (M) A GFP+ circulating blood cells (indicated by arrows) was observed by confocal microscopy in the heart at 36 hpf. (N) Flow cytometry result showing the proportion of GFP+ blood cells in embryos at 28 hpf. Blood cells were taken from the heart of 5-10 embryos at 28 hpf. The average in parenthesis was the mean of three experiments. (O) Flow cytometry results showing the proportion of GFP+ cells in adult blood (left) and kidney marrow (right). The showed were representative results from single fish. The average from three fish was shown in parenthesis. |

Blockage of primitive erythropoiesis by trim33 knockdown has little effect on somite hematopoiesis. (A) Effect of trim33 knockdown on primitive erythropoiesis. Wild-type embryos at the one-cell stage were injected with the control MO (cMO) or trim33-MO and collected at 30 hpf for detection of hemoglobin by O-dianisidine staining. The embryos were ventrally viewed with anterior to the left. The ratio of embryos with the representative pattern was indicated. Note that the number of red-blood cells was drastically reduced in trim33 morphants, indicating an effective knockdown. (B and C) Effect of trim33 knockdown on LPM (B) and somite hematopoiesis (C). Tg(gata1a:DsRed) (B) or Tg(foxc1b:EOS) (C) embryos at the one-cell stage were injected with corresponding MOs. For injected Tg(foxc1b:EOS) embryos, five pairs of new born somites were photoactivated at 20s stage. The circulating blood cells taken from a group of 5 embryos at 30 hpf were sorted by flow cytometry and the number of DsRed+ (B) or red-EOS+ cells (C) per embryo was averaged from three independent experiments. *, statistically significant with p < 0.05); ns, non-significance, p > 0.05. |