- Title
-
In vivo modulation of endothelial polarization by Apelin receptor signalling
- Authors
- Kwon, H.B., Wang, S., Helker, C.S., Rasouli, S.J., Maischein, H.M., Offermanns, S., Herzog, W., Stainier, D.Y.
- Source
- Full text @ Nat. Commun.
|
EC polarization during development. (a-i′) Three-dimensional-rendered confocal stack images of the trunk region of 30, 48 and 72 h.p.f. Tg(kdrl:NLS-EGFP);Tg(fli1a:B4GALT1-mCherry) animals injected intravascularly with qdot 655. The white and red boxes in the left panels (a,d,g) are enlarged in the middle (b,e,h) and right (c,f,i) panels, respectively. (b′,c′,e′,f′,h′,i′) Surface-rendered images of boxed regions. White dashed arrows indicate the direction of blood flow. White arrowheads point to polarized ECs and yellow arrowheads point to non-polarized ECs. (j) Schematic representation of EC polarization during development in the trunk region (i and ii) and illustration of the various polarization patterns (iii). (k,l) Quantification of EC polarization in the DA, PCV (k) and ISVs (l). The numbers of larvae (n) and ECs (n′) are indicated above the graph. Anterior to the left, dorsal to the top. Scale bars, 20 µm. aISV, arterial intersegmental vessel; DA, dorsal aorta; PCV, posterior cardinal vein; vISV, venous intersegmental vessel; 1°, primary sprouts; 2°, secondary sprouts. Error bars, s.e.m. EXPRESSION / LABELING:
|
|
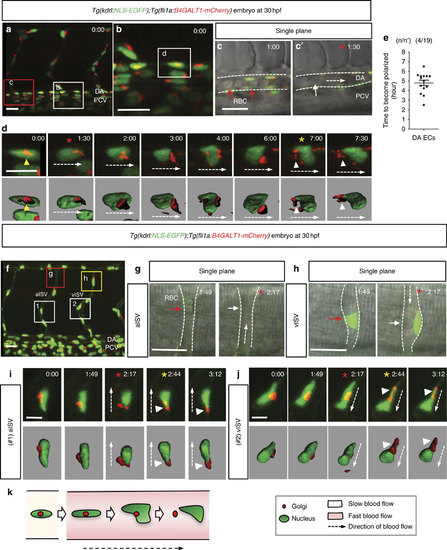
EC polarization by blood flow. (a-d) Three-dimensional-rendered confocal stack images of the trunk region of 30 h.p.f. Tg(kdrl:NLS-EGFP);Tg(fli1a:B4GALT1-mCherry) embryos. White box in a is enlarged in b and single plane images of red boxed region in a is enlarged in c and c′. (c,c′) At t=60 min, RBCs (red arrows) in the DA are mainly stationary, whereas by 90 min they are moving too fast to be clearly distinct (white arrow). Red asterisks indicate the time when vigorous circulation starts. (d) Confocal time-lapse images of EC in the white box in b. Surface-rendered images are displayed below. Yellow asterisk indicates the time when the EC is polarized. Time (hours:minutes) is shown in the top right corner of the images. (e) Quantification of time required for DA ECs to become polarized starting at 30 h.p.f. and at 28.5 °C. Numbers of larvae (n) and ECs (n′) indicated above the graph. Error bars represent s.e.m. (f-j) Three-dimensional-rendered confocal stack images of the trunk region of 30 h.p.f. Tg(kdrl:NLS-EGFP);Tg(fli1a:B4GALT1-mCherry) embryos. (g,h) Red and yellow boxes in f is enlarged in g and h. White dashed arrows indicate direction of blood flow. White dashed lines indicate ISV boundaries. (g) Red arrow points to stationary RBCs in the SeA; white arrow denotes apparent absence of RBCs. (h) At t=1:49, lumen formation does not appear to be completed (red arrow), whereas at t=2:17, a lumen appears to be formed (white arrow). (i,j) Time-lapse images of ECs marked with numbers (1 (i) and 2 (j)) in f. White dashed arrows indicate direction of blood flow. White arrowheads point to polarized Golgi apparatus. Red asterisks indicate the time when vigorous circulation starts. Yellow asterisks indicate the time when the EC is polarized. Time (hours:minutes) is shown in the top right corner of the images. (k) Schematic model showing the process of EC polarization by blood flow. Anterior to the left, dorsal to the top. Scale bars, 20 µm (a-c,f-h), 7 µm (d,i,j). aISV, arterial intersegmental vessel; DA, dorsal aorta; PCV, posterior cardinal vein; vISV, venous intersegmental vessel. Error bars, s.e.m. EXPRESSION / LABELING:
|
|
EC polarization by blood flow is reversible. (a-d′) Three-dimensional-rendered confocal stack images of 48 h.p.f. Tg(kdrl:NLS-EGFP);Tg(fli1a:B4GALT1-mCherry) embryos uninjected (a,b,b′) or injected with tnnt2a MO (c,d,d′). White boxes in left panels (a,c) enlarged in middle panels (b,d). (b′,d′) Surface-rendered images of boxed regions. White arrowheads point to polarized ECs and yellow arrowheads point to non-polarized ECs. Yellow dashed lines indicate ventral boundary of DA. (e) Quantification of EC polarization. Numbers of larvae (n) and ECs (n′) indicated above the graph. (f) Three-dimensional-rendered confocal stack images of 36 h.p.f. Tg(kdrl:NLS-EGFP);Tg(fli1a:B4GALT1-mCherry) embryo injected with tnnt2a MO. (g) Time-lapse confocal images of white boxed region in (f) surface-rendered images displayed below; yellow arrowheads point to non-polarized ECs; time (hours:minutes) shown in the top right corner of the images. (h) Three-dimensional-rendered confocal stack images of Tg(kdrl:NLS-EGFP);Tg(fli1a:B4GALT1-mCherry) larva treated with 10 mM BDM starting at 96 h.p.f. (i) Time-lapse confocal images of white boxed region in (h) surface-rendered images displayed below; white arrowheads point to polarized ECs and yellow arrowheads point to depolarized ECs; red bars indicate diameter of the DA; time (hours:minutes) shown in the top right corner of the images. (j) Schematic representation of EC depolarization when blood flow stops. (k) Schematic time table of BDM treatment of Tg(kdrl:NLS-EGFP);Tg(fli1a:B4GALT1-mCherry) embryos before 72 h.p.f.. (l-s) Three-dimensional-rendered confocal stack images of Tg(kdrl:NLS-EGFP);Tg(fli1a:B4GALT1-mCherry)embryos and larvae treated with 10 mM BDM for 12 h (l,m) or 10 mM BDM for 12 h, then dimethylsulfoxide (DMSO) for 12 h (n,o), or treated continuously with 10 mM BDM (p,q) or DMSO (r,s) for 24 h. White arrowheads point to polarized ECs and yellow arrowheads point to non-polarized ECs. (t) Quantification of EC polarization of 60 or 72 h.p.f. Tg(kdrl:NLS-EGFP);Tg(fli1a:B4GALT1-mCherry embryos and larvae treated with BDM for 12 h, BDM for 12 h then DMSO for 12 h, BDM for 24 h and DMSO for 24 h. Numbers of larvae (n) and ECs (n′) are indicated above the graph. Anterior to the left, dorsal to the top. Scale bars, 20 µm. DA, dorsal aorta; PCV, posterior cardinal vein. Error bars, s.e.m. |
|
Aplnr signalling modulates EC polarization. (a-i) Confocal images of 72 h.p.f. Tg(kdrl:NLS-EGFP);Tg(fli1a:B4GALT1-mCherry) wild-type (a-c) aplnra+/- (d-f) and aplnrb+/- (g-i) larvae. Left panels: (a,d,g) three-dimensional (3D)-rendered confocal images of the trunk region; left centre panels: (b,e,h) 3D-rendered confocal images of the white boxed region in the left panels; right centre panels: (b′,e′,h′) 3D surface-rendered images of the centre left panels; right panels: (c,f,i) single plane images of the boxed region in the left panels. White arrowheads point to polarized ECs and yellow arrowheads point to non-polarized ECs. Yellow dashed lines denote the ventral boundary of the DA. White dashed lines denote the boundary of the DA in the single plane images. Red bars indicate the diameter of the DA. White dashed arrows denote the direction of blood flow. (j) Quantitative analysis of EC polarization in 72 h.p.f. wild type, aplnra+/- and aplnrb+/- larvae. The numbers of larvae (n) and ECs (n′) are indicated above the graph. ***P<0.05. (k) Design of the transplantation experiments: Tg(kdrl:NLS-EGFP);Tg(fli1a:B4GALT1-mCherry) wild type or aplnrb+/- cells were transplanted into wild type AB hosts and the transgenic ECs in the DA scored for polarization at 72 h.p.f.. (l-o) Three-dimensional-rendered confocal images of 72 h.p.f. Tg(kdrl:NLS-EGFP);Tg(fli1a:B4GALT1-mCherry) wild-type hosts with wild-type (l,m) or aplnrb+/- (n-o) transplanted cells. (p) Quantitative analysis of EC polarization of wild type or aplnrb+/- cells transplanted into wild-type hosts. The numbers of larvae (n) and ECs (n′) are indicated above the graph. (q-t) Confocal images of 72 h.p.f. Tg(kdrl:NLS-EGFP);Tg(fli1a:B4GALT1-mCherry) wild type (q,r,u) and apln-/- (s-u) larvae. The white boxes in the left panels (q,s) are enlarged in the right panels (r,t). (u) Quantitative analysis of EC polarization in 72 h.p.f. wild type and apln-/- larvae. The numbers of larvae (n) and ECs (n′) are indicated above the graph. Anterior to the left, dorsal to the top. Scale bars, 20 µm. D, donor; DA, dorsal aorta; H, host; PCV, posterior cardinal vein. Error bars, s.e.m. EXPRESSION / LABELING:
PHENOTYPE:
|
|
Endothelial cell polarization during migration. (a-c′) 3D-rendered confocal stack time-lapse images of the trunk region of a 36 hpf Tg(kdrl:NLS-EGFP);Tg(fli1a:B4GALT1-mCherry) embryo. (b) Time-lapse images of the white box in (a). Time (hours:mins) is shown in the top right corner of the images. White arrowheads point to polarized ECs, yellow arrowheads to non-polarized ECs. (c) A confocal stack image of the white box in (a) at t=13:03. (c′) Enlarged white box from (c). White arrow points to the lumen of the vessel. Red arrowhead points to the localization of the Golgi apparatus on the luminal side of the blood vessel. (d) Schematic representation of endothelial polarization during migration. Scale bars, 15 µm (a-c). Anterior to the left, dorsal to the top. DA, dorsal aorta; ISV, intersegmental vessel. |
|
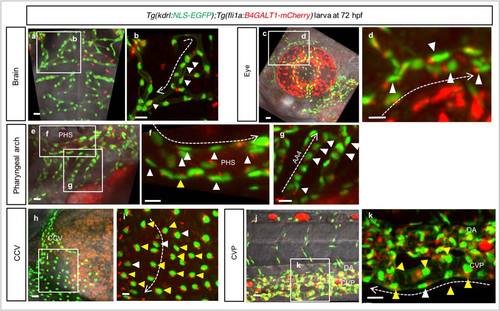
Endothelial cell polarization in different vascular beds. (a-k) 3D-rendered confocal stack images of different vascular beds: brain (a, b), eye (c, d), pharyngeal arch (e-g), CCV (h, i) and CVP (j, k) of a 72 hpf Tg(kdrl:NLS-EGFP);Tg(fli1a:B4GALT1-mCherry) larva. White arrowheads point to polarized ECs, yellow arrowheads to non-polarized ECs. Scale bars, 15 µm. White dashed arrows indicate the direction of blood flow. Anterior to the left, dorsal to the top. AA4, secondary pharyngeal arch; CCV, common cardinal vein; CVP, caudal vein plexus; DA, dorsal aorta; PHS, primary head sinus. |
|
Endothelial cell polarization in DA and PCV. (a) 3D-rendered confocal stack images of the trunk region of a 30 hpf Tg(kdrl:NLS-EGFP);Tg(fli1a:B4GALT1-mCherry) embryo. (b, c) Confocal time-lapse images of the ECs in the white (b) and red (c) boxes in (a). Surface rendered images are displayed below. White arrowheads point to polarized ECs, yellow arrowheads to non-polarized ECs. Red asterisk indicates the time when vigorous blood circulation starts. Yellow asterisk indicates the time when ECs are polarized. White dashed arrows indicate the direction of blood flow. (d) 3D-rendered confocal stack images of ECs undergoing cell division in the trunk region of a 36 hpf Tg(kdrl:NLS-EGFP);Tg(fli1a:B4GALT1- mCherry) embryo. (e) Time-lapse image of white box in (d). Surface rendered images are displayed below. White asterisks indicate ECs under cell division. White arrowheads point to the Golgi apparatus. White arrows indicate the direction of blood flow. Time (hours:mins) is shown in the top right corner of the images. (f) Schematic representations showing EC polarization after the onset of blood flow (i) and after cell division under vigorous blood flow (ii). (g, h) 3D-rendered confocal stack images of the trunk region of a 36 hpf Tg(kdrl:NLS-EGFP);Tg(fli1a:B4GALT1-mCherry) embryo. (h) Time-lapse images of the white box in (g). Surface rendered images are displayed below. White arrowheads and yellow arrowheads point to ECs undergoing cell division. Time (hours:mins) is shown in the top right corner of the images. Anterior to the left, dorsal to the top. Scale bars, 20 µm (a,d and g), 7 µm (b, c, e and h). DA, dorsal aorta; PCV, posterior cardinal vein. |
|
Endothelial cell polarization is dependent on blood flow. (a-c) 3D-rendered confocal stack images of the trunk region of a 48 hpf Tg(kdrl:NLS-EGFP);Tg(fli1a:B4GALT1-mCherry) embryo. (b, c) Time-lapse image of ECs identified in (a) (#1, b; #2, c). Surface-rendered images are displayed below. White arrowheads point to polarized ECs, yellow arrowheads to non-polarized ECs. Time (hours:mins) is shown in the top right corner of the images. (d, e, f and g) 3D-rendered confocal stack images of the trunk region of 96 hpf Tg(kdrl:NLS51 EGFP);Tg(fli1a:B4GALT1-mCherry) uninjected (d, e) and gata1 morphant (f, g) larvae. The white boxes in the left panels (d, f) are enlarged in the middle panels (e, g). Surface-rendered images of boxed areas are shown in the right panels (e′, g′). White arrowheads point to polarized ECs. Anterior to the left, dorsal to the top. Scale bars, 20 µm (a, d, e,f and g), 7 µm (b, c). DA, dorsal aorta; PCV, posterior cardinal vein; ISV, intersegmental vessel. |
|
aplnrb modulates endothelial cell polarization. (a-d) in situ hybridization of 48 hpf wild-type embryos for aplnra (a), aplnrb (b), apln (c) and apela (d) expression. (e) Bright field images of 60 hpf wild-type, aplnra +/-, aplnra -/- , aplnrb +/- and aplnrb -/- embryos. (f-g′) 3D-rendered confocal stack images of a 72 hpf Tg(kdrl:NLS61 EGFP);Tg(fli1a:B4GALT1-mCherry) aplnrb +/- larva. The white box in (f) is enlarged in (h) and the single plane images of the red box in (f) are enlarged in the right panels (g, g′). (g, g′) At t=0:19, red blood cells (RBCs, red arrows) in the DA are mainly stationary whereas by t=0:39 (39 mins) they are moving too fast to be clearly distinct (white arrows). (i) Time-lapse confocal images of DA ECs in the white box in (h). White dashed arrows indicate the direction of blood flow. White arrowheads point to polarized ECs, yellow arrowheads to non-polarized ECs. Time (hours:mins) is shown in the top right corner of the images. Anterior to the left, dorsal to the top. Scale bars, 40 µm (a-d), 100 µm (e), 20 µm (f-i). DA, dorsal aorta; PCV, posterior cardinal vein.EXPRESSION / LABELING:
PHENOTYPE:
|
|
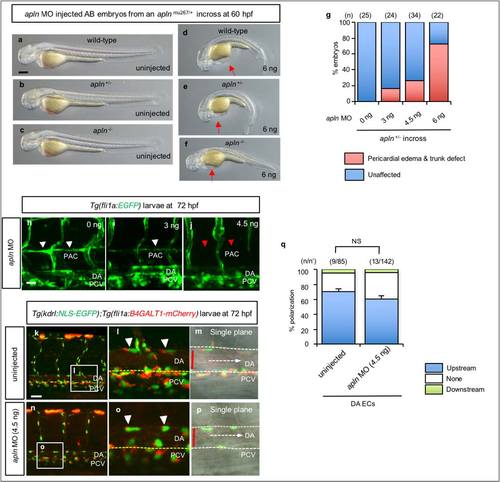
Endothelial cell polarization appears unaffected in apln morphants. (a-f) Bright field images of 60 hpf embryos from an apln+/- incross uninjected (a-c) or injected with apln MO (6 ng) (d, e, f). Red arrows point to pericardial edema. (g) Quantative analysis of 60 hpf apln MO injected embryos from an apln+/- incross. The numbers of larvae (n) are indicated above the graph. (h-j) 3D rendered confocal images of 72 hpf Tg(fli1a:EGFP) larvae injected with apln MO (4.5 ng). White arrowheads point to the PAC vessel (h, i). Red arrowheads indicate absence of PAC in apln morphants (j). (k-p) Confocal images (lateral views) of 72 hpf Tg(kdrl:NLS78 EGFP);Tg(fli1a:B4GALT1-mCherry) larvae uninjected (k-m) or injected (n-p) with apln MO(4.5 ng). The white boxes in the left panels (k, n) are enlarged in the middle panels (l, o) and the single plane images, with brightfield, of those boxed areas are enlarged in (m) and (p). (q) Quantitative analysis of EC polarization in 72 hpf uninjected and apln MO injected (4.5 ng) larvae. The numbers of larvae (n) and ECs (n′) are indicated above the graph. Anterior to the left and dorsal to the top. Scale bars, 100 µm (a-f), 20 µm (h-p). DA, dorsal aorta; PCV, posterior cardinal vein. Error bars, SEM.PHENOTYPE:
|
|
apln mutants show reduced endothelial cell numbers. (a-b) in situ hybridization of 48 hpf wild-type (a) and apln -/- (b) embryos for apela expression. The numbers of embryos examined are indicated in the top right corner of the images. (c, d) Quantitative analysis of EC numbers per three somites in 72 hpf aplnrb+/- (c) and apln -/- (d) larvae. The numbers of larvae (n) and ECs (n′) are indicated above the graph. (e-f′) Confocal images (lateral views) of 60 hpf Tg(fli1a:EGFP); Tg(-0.8flt1:RFP) wild-type (e, e′) and aplnrb+/- (f, f′) embryos. (g-i) in situ hybridization of 48 hpf wild-type (g), aplnrb +/- (h) and aplnrb -/- (i) embryos for vegfr3 expression. (j-k′) Confocal images (lateral views) of 60 hpf Tg(fli1a:EGFP); Tg(EPV.TP1-Mmu.Hbb:hist2h2l97 mCherry) wild-type (j, j′) and aplnrb+/- (k, k′) embryos. The numbers of embryos examined are in the top right corner of the images (e′, f′, g-i, j′, k′). Anterior to t 98 he left, dorsal to the top. Scale bars, 60 µm (a-b, g-i) , 20 µm (e-f′, j-k′). DA, dorsal aorta; PCV, posterior cardinal vein. Error bars, SEM.PHENOTYPE:
|
|
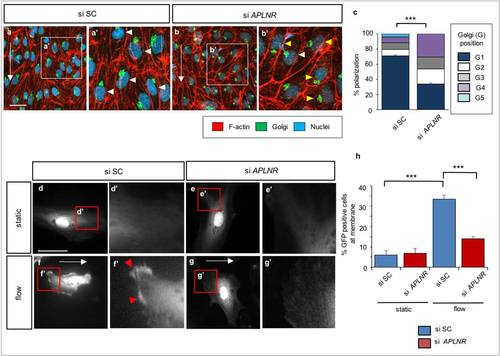
APLNR signaling modulates the polarization of human arterial endothelial cells. (a-b′) Immunofluorescence staining of HUAECs transfected with si SC or si APLNR subjected to laminar flow at 20 dynes/cm2 for 18 hours. Cells were fixed and stained with the GM130 Golgi antibody (green), Phalloidin (red) and DAPI (blue). White arrowheads point to polarized ECs (i.e., Golgi apparatus positioned within ±45° against the direction of flow (G1)). Yellow arrowheads point to depolarized ECs (i.e., Golgi positioned within + 45° to +180° and +180° to -45° against the direction of flow (G2-G4)). (c) Quantification of polarization of HUAECs subjected to laminar flow at 20 dynes/cm2 for 18 hours transfected with si SC or si APLNR. n > 300 cells, from at least three independent experiments. (d-g′) Fluorescent images of HUAECs transfected with ARRB-GFP as well as si SC or si APLNR subjected to laminar flow at 20 dynes/com2 for 15 mins. Red arrowheads point to plasma membrane localization of ARRB-GFP after 15 mins of laminar flow. (h) Quantification of ARRB-GFP membrane localization of HUAECs subjected to static condition or laminar flow at 20 dynes/cm2 for 15 mins transfected with si SC or si APLNR. *** P<0.05. Scale bars, 20 µm. Error bars, SEM. |
|
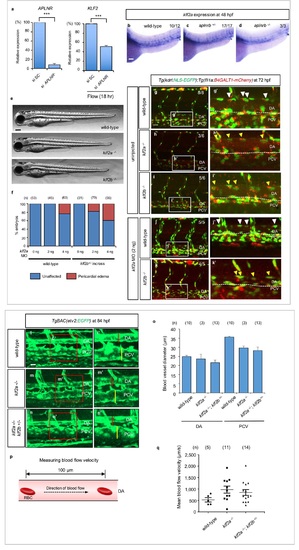
KLF2 regulation by APLNR and endothelial cell polarization in klf2 mutants. (a) qPCR analysis. Validation of efficacy of siRNA for APLNR in HUVECs (left). KLF2 expression in APLNR KD HUVECs transfected with si SC or si APLNR subjected to laminar flow at 12 dynes/cm2 for 18 hours (right). *** P<0.05. KLF2 expression is downregulated in HUVECs after APLNR knock-down. (b-d) in situ hybridization for klf2a expression in 48 hpf wild-type (b), aplnrb+/- (c) and aplnrb -/-(d) embryos. The numbers of embryos examined are indicated in the top right corner of the images. (e) Brightfield images of 72 hpf wild-type, klf2a -/- and klf2b -/- larvae. (f) Quantification of larvae showing pericardial edema at 72 hpf. klf2a MO (2 and 4 ng) was injected into one-cell stage embryos from wild-type or klf2b+/- incrosses. (f-k′) Confocal images of 72 hpf Tg(kdrl:NLS-EGFP);Tg(fli1a:B4GALT1-mCherry) wild-type (g, g′), klf2a -/- (h, h′), klf2b-/- (i, i′), wild-type injected with klf2a MO (2ng) (j, j′) and klf2b-/- injected with klf2a MO (2ng) (k, k′) larvae. The white boxes in the left panels (g, h, i, j and k) are enlarged in the right panels (g′, h′, i′, j′ and k′). White dashed lines denote the ventral boundary of the DA. White arrowheads point to polarized ECs, yellow arrowheads to non-polarized ECs. The numbers of larvae examined are indicated in the top right corner of the images (g, h, i, j, k). (l-o′) Confocal images of 84 hpf TgBAC(etv2:EGFP) wild type (l, l′), klf2a -/- (m, m′) and klf2a -/-; klf2b+/- (n, n′) larvae. The red boxes in the left panels (l, m and n) are enlarged in the right panels (l′, m′ and n′). Red bars represent the diameter of the wild type DA, yellow bars the diameter of the wild-type PCV. (o) Quantification of blood vessel diameter in 84 hpf wild-type, klf2a -/- and klf2a -/-; klf2b+/- larvae. The numbers of larvae examined are indicated in the top of the graph. (p) Schematic representation of blood flow velocity measurements. (q) Quantification of blood flow velocity in 84 hpf wild-type, klf2a -/- and klf2a -/-; klf2b+/- larvae. The numbers of larvae examined are indicated in the top of the graph. Anterior to the left, dorsal to the top. Scale bars, 60 µm (b-d), 100 µm (e), 20 µm (g-n). DA, dorsal aorta; PCV, posterior cardinal vein. Error bars, SEM. |


