
- Title
-
A toolbox to study epidermal cell types in zebrafish
- Authors
- Eisenhoffer, G.T., Slattum, G., Ruiz, O.E., Otsuna, H., Bryan, C.D., Lopez, J., Wagner, D.S., Bonkowsky, J.L., Chien, C.B., Dorsky, R.I., Rosenblatt, J.
- Source
- Full text @ J. Cell Sci.
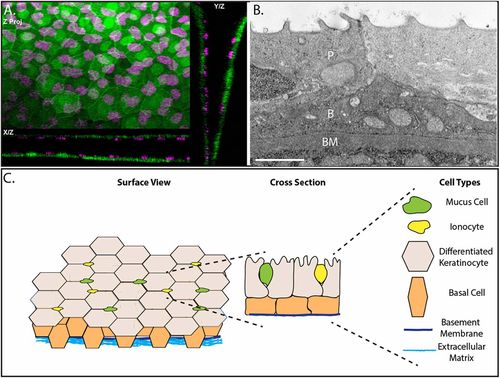
The epidermis of developing zebrafish is a bilayer. (A) Confocal maximum intensity projections of an epidermis in 4 day post-fertilization (dpf) Tg(krt4:GFP) (green) transgenic zebrafish with immunostaining for p63 (magenta). (B) A transmission election micrograph of a 4 dpf epidermis. P, periderm; B, basal layer; BM, basement membrane. (C) Schematic of the developing zebrafish epidermis. Scale bar: 2 μm. |
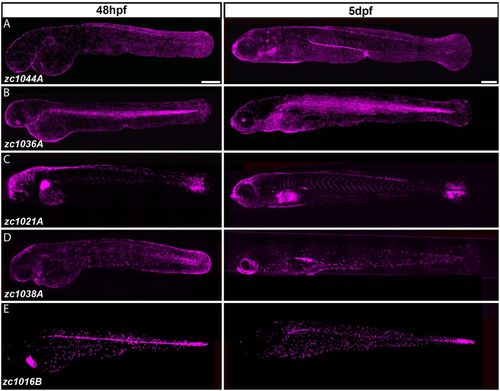
Identification of Gal4 enhancer trap lines expressed in distinct cell types of the developing epidermis. (A-E) Composite images from multiple maximum intensity projections of Gal4 enhancer trap lines driving Tg(UAS-E1b:nfsB-mCherry) (shown in magenta) in 48-hour- and 5-day-old larvae. Scale bars: 250 μm. |

GAL4 enhancer trap lines are expressed in a subset of different epithelial cell types. (A-C) Maximum intensity projections of confocal images demonstrate expression of Gal4 enhancer trap lines (magenta) with respect to the periderm, shown by krt4:GFP expression (green). (D-F) Characterization of the basal cell line with antibody staining for (D) p63 and the GET-basal line (zc1036A), (E) p63 enhancer driving GFP stained with p63 antibody, and (F) p63:EGFP co-localization with the GET-basal line. Scale bars: 25 μm. |

Crossing epithelial Gal4 lines to UAS lines that provide tools for developmental studies. (A,B) Cells can be fluorescently labeled and tracked over time with the periderm Gal4 line (zc1044A) driving expression of photo-convertible protein Kaede, Tg(UAS-E1b:Kaede)s1999t. Expression of Kaede is detected as green fluorescence before exposure to blue (UV) light (A), and red (shown here as magenta) after exposure (B). (C-F) The labeled epithelial cells can be readily ablated using the nitroreductase–metronidazole system, Tg(UAS-E1b:nfsB-mCherry). (C-D) Representative bright-field images of wild-type (C) and zc1036A (D) 48 hpf embryos after 24 h treatment with MTZ to ablate the cells. Arrowhead in D′ denotes defects in the developing median fin epidermis. (E-F) The MTZ-exposed zc1036A cells undergo apoptosis (activated caspase-3-positive cells in green) and cause defects in the developing embryo. C-D represent data from a single experiment performed in triplicate. Scale bars: 25 μm in A-B, 250 μm in C-D, 50 μm in E-F. |
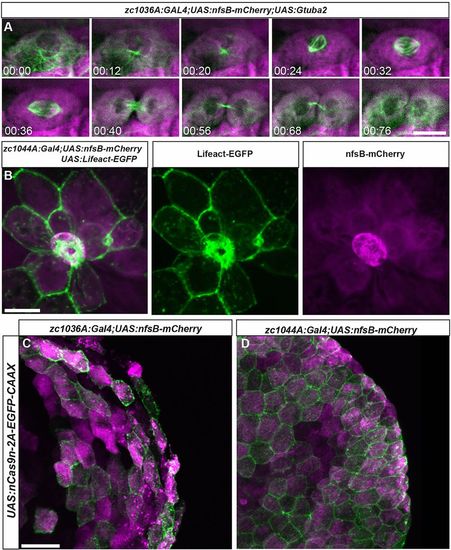
Live imaging of cell division and death in the developing epidermis. (A) Still images from a time lapse movie of cell division in the basal Gal4 line (zc1036A) driving expression of fluorescently labeled microtubules Tg(UAS:Gtuba2). (B) Image of a cell being extruded from the epidermis of a live zebrafish in the periderm Gal4 line (zc1044A) driving expression of fluorescently labeled F-actin Tg(UAS:Lifeact-EGFP). (C,D) Expression of Tg(UAS:nCas9n-2A-EGFP-CAAX) in zc1036A (C) and zc0144A (D) GAL4 lines. Scale bars: 20 μm in A, 25 μm in B, 25 μm in C,D. |

Spatial and temporal control of Gal4-driven gene expression. (A) The photo-cleavable morpholino directed against gal4 was injected in Et(Gal4-VP16)zc1044A;Tg(UAS-E1b:nsfB-mCherry) transgenic line and embryos were exposed to UV light at 28-32 hpf. (B-H) Representative bright-field (B,D,F) and fluorescent (C,E,G,H) images 48 h after exposure to UV, at 3 dpf. Box in G denotes area of magnification for H. B-H represent data from three independent experiments. Scale bars: 250 μm in B-G, 50 μm in H. |

Mitotracker staining reveals enhancer trap line expressed in ionocyte population. Mitotracker staining (magenta) in Tg(krt4:GFP) (green) zebrafish. Co-expression of mitotracker (green) in the zc1016B enhancer trap line (magenta). |

Characterization of Tg(p63:EGFP) transgenic zebrafish. Max projection confocal images of Tg(p63:EGFP) transgenic zebrafish at 24hpf and 48hpf. |

High-resolution atlas of the identified Gal4 enhancer trap lines. Max projection confocal images demonstrating expression in the whole animal for the GET-ionocyte (A), GET-Periderm (B) and GET-Basal (C) lines. High magnification images of different regions along the animal for each Gal4 enhancer trap line are also shown. A list of cell types each line is expressed in is presented in Table S1. Depending on the experiment and approach, expression in other cell types may complicate perturbation studies. Scale bars, 50μm for the whole animal images, 20μm for the high magnification images. |
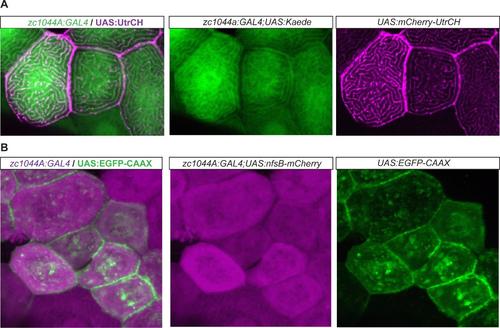
Epithelial enhancer trap line driving expression of UAS cytoskeletal fluorescent reporter lines. Expression of the UAS cytoskeletal fluorescent reporters by the Periderm-GET line reveals localization of F-actin (A) and membrane bound fluorescent expression (B), respectively, within the developing periderm (48hpf). (A). Expression of UAS:mCherry-UtrCH (magenta) in the Et(Gal4-VP16)zc1044A; Tg(UAS-E1b:Kaede)s1999t (green) line; and (B) UAS:EGFP-CAAX (green) in Et(Gal4- VP16)zc1044A;Tg(UAS-E1b:nsfB-mCherry) (magenta) line. |